Using 21 farms from the NESARE Crops to Cow project, FE was examined from lowest to highest milk production, the harvesting year (2016 and 2017) as well as the season (Figure 1). There was a significant drought in 2016, which negatively impacted the corn silage starch content and yield. The following year was very different as 2017 had ample moisture during the growing season and corn silage quality and quantity were improved.
One concern with FE is thinking higher is better. Cows eat pounds and if dry matter intake is low for a high level of production, eventually that may result in negative performance. Cows need a certain amount of fiber, starch, and protein pounds to maintain normal rumen function. Herds that generally maintain consistent production throughout the year and from year to year have a good balance with FE.
Spring 2017 showed the most variability in FE regarding extremely high numbers. These could reflect heat stress as some farms were sampled in June compared to early spring. The one constant observation excluding Spring 2017, was the lowest producing herds also had the lowest FE. This was most notable in fall 2017. One possible explanation is cows trying to meet their energy needs by consuming more feed. If that situation is occurring with today’s high feed costs, that can negatively affect cash flow. It is not only the purchased grain cost but the impact to forage inventory and the possible need to purchase forages or adjust rations to feed more byproducts.
The dairy operation is very dynamic, and this was evident in the ranking of energy corrected milk (ECM) from lowest to highest over the sampling periods. There were 4 farms that consistently maintained the highest level of ECM, which included farms 17, 19, 20, and 21. There were farms that dramatically improved in production within the same harvest year and then there were farms that took a dramatic drop in the next year. Since corn silage comprised a major portion of the forage ration, some dairies had challenges complementing their forages and obtaining similar production from the previous year. This makes a strong case for continually monitoring performance metrics because they can be a moving target. When FE is too high or too low then some intervention needs to occur to avoid negative impacts to production and ultimately cash flow.
Figure 1. Feed efficiency (FE) comparison on 21 farms sorted by energy corrected milk (ECM), season, and year.
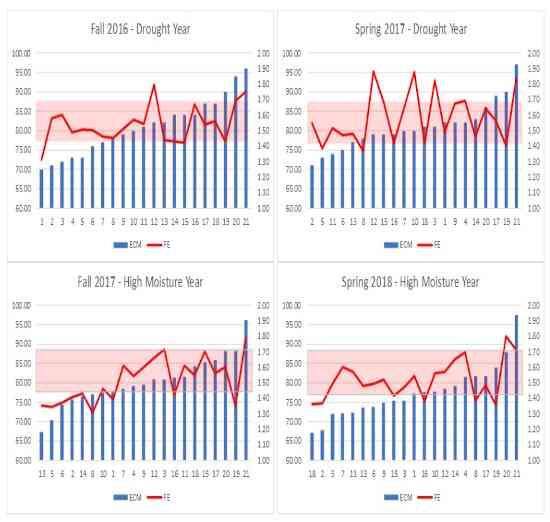
Note: ECM equation: (12.82 * fat lbs.) + (7.13 * protein lbs.) + (0.323 * milk lbs.)
FE = ECM/dry matter intake
Source: Ishler et. al., 2019. The Impact of Corn Silage Harvesting and Feeding Decisions on Income Over Feed Costs. NESARE ENE15-136.
Economic perspective:
Monitoring must include an economic component to determine if a management strategy is working or not. For the lactating cows, income over feed cost is a good way to check that feed costs are in line with the level of milk production. Starting with July 2014’s milk price, income over feed cost was calculated using average intake and production for the last six years from the Penn State dairy herd. The ration contained 63% forage consisting of corn silage, haylage, and hay. The concentrate portion included corn grain, candy meal, sugar, canola meal, roasted soybeans, Optigen, and a mineral vitamin mix. All market prices were used.
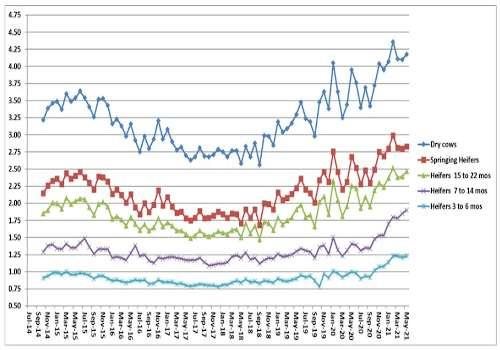
Also included are the feed costs for dry cows, springing heifers, pregnant heifers, and growing heifers. The rations reflect what has been fed to these animal groups at the Penn State dairy herd. All market prices were used.
Income over feed cost using standardized rations and production data from the Penn State dairy herd.
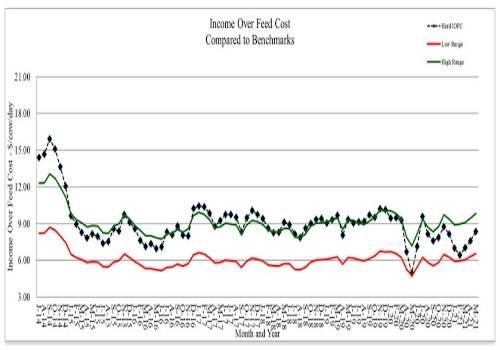
Note: May’s Penn State milk price: $19.53/cwt; feed cost/cow: $8.04; average milk production: 84 lbs.
Feed cost/non-lactating animal/day.
Source : psu.edu