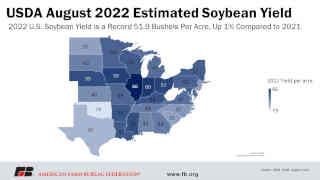
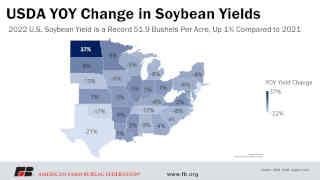
North Dakota leads with the largest year-over-year increase in estimated soybean yield, up 37%, reporting that soybean yields will be 35 bushels per acre, up from 25.5 bushels per acre in 2021. South Dakota shows the second-largest year-over-year increase, up 8%, moving from 40 bushels per acre in 2021 to 43 bushels per acre in 2022. Minnesota is expected to increase soybean yields by 6% compared to 2021, moving from 47 bushels per acre to 50 bushels per acre in 2022.
The below maps include USDA’s August 2022 soybean yield estimates and the year-over-year change in soybean yield compared to 2021.
Soybean Supply and Demand Expectations from August WASDE
USDA’s soybean yield estimate of 51.9 bushels per acre increases the supply estimate for the 2022/23 marketing year in the August WASDE, which adjusts soybean production to 4.53 billion bushels, increasing 26 million bushels, or less than 1%, compared to the overall soybean production estimate reported in the July WASDE. Compared to 2021, this yield adjustment and increase in soybean production pushes the 2022 soybean production to 2.2% higher than 2021, making it the largest soybean production year on record if it comes to fruition. USDA lowered soybean planted acres and harvested acres by 300,000 acres to accommodate the resurveyed states. USDA also made adjustments to the 2021/22 marketing year demand expectations that increased stocks by 4.7% or 10 million bushels, that will be carried over to 2022 and increasing supply. The reduced planted soybean acres but additional amount of soybean production and beginning stocks net to add 36 million bushels to the supply-side, which is a 1.4% increase in overall U.S. soybean supply compared to 2021, rising to 4.77 billion bushels from 4.71 billion bushels.
On the soybean demand side for the 2022/23 crop year, USDA increased expectations for soybean exports, up nearly 1% or 20 million bushels, and added 1 million bushels to the residual use. Ending stocks expectations for 2022/23 soybean rose 6.5% compared to July, up 15 million bushels, which pushed the stocks-to-use ratio to 5.3% from 5.1%. USDA estimates the average farm price for soybeans to lower from July’s $14.40 per bushel estimate to $14.35 per bushel in August, about $1.05 per bushel higher than in 2021, and just shy of the record $14.40 per bushel in 2012.
2022 Corn Yield
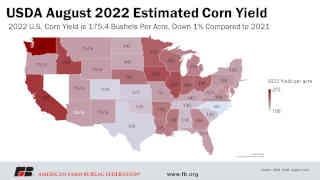
For non-irrigated corn, the highest yields start in Iowa where farmers put yields at 205 bushels per acre, equivalent to yields in 2021. Illinois also reported a near flat-rate yield estimate compared to 2021, reporting the second-highest yield of 203 bushels per acre, compared to 202 bushels per acre last year. Minnesota is estimated to have the third-highest non-irrigated corn yield with 193 bushels per acre, up 8% from 2021 when Minnesota’s drought-stricken corn yielded 178 bushels per acre. Washington leads irrigated corn yields with an estimated 225 bushels per acre, an increase of 3% compared to 2021. California is just behind with an estimated 220 bushels per acre of corn, up 17% from 2021 when the state yield was 188 bushels per acre.
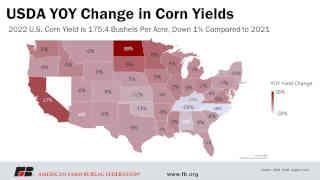
North Dakota has the largest year-over-year increase in corn yields, up 38% compared to 2021, moving from 105 bushels per acre to 145 bushels per acre. The second-largest percentage increase is California, circuitously reported above with a 17% increase compared to 2021. South Dakota and Minnesota both rebound from drought-stricken corn in 2021, increasing yields in 2022 by 9% and 8% respectively.
The below maps include USDA’s August 2022 corn yield estimates and the year-over-year change in corn yield compared to 2021.
Corn Supply and Demand Expectations from August WASDE
Given the 175.4 bushel per acre estimate for corn yield, USDA lowers production for the 2022/21 marketing year by 146 million bushels in the August WASDE, dropping from 14.5 billion bushels in July to 14.3 billion bushels, which would be a 5% decrease compared to production levels of corn in 2021. USDA reported a reduction in domestic use, primarily for ethanol use, on the 2021/22 corn balance sheet, which increased ending stocks for the marketing year, thus increasing the quantity of corn carry-over into the 2022/23 marketing year by about 20 million bushels. Minor changes to corn planted acres following the results of the three states resurveyed after June decreased planted and harvested corn acres by 100,000 acres.
Exports of corn were also reduced by 25 million bushels. The reductions in major use categories, totaling 45 million bushels, compound reductions in corn production and is not made up in the increased carry-over from 2021/22. Ending stocks for the 2022/23 marketing year lowered 82 million bushels to 1.3 billion bushels, about 9.3% lower compared to 2021 ending stocks. The stocks-to-use ratio for 2022 sits at about 9.6%, lower than the 10.3% reported for 2021. USDA kept the average farm price for corn at $6.65 per bushel in August as it was in July, sitting about $1.42 per bushel higher than in 2021. This is the second-highest historical average, behind $6.89 per bushel in 2012.
June 30 Acreage Update
As previously described, USDA included in the August Crop Production report updates to the June 30 Acreage report following the resurveying of farmers due to planting delays in Minnesota, North Dakota and South Dakota. Farmers in those states had reported specific acreage as “not yet planted” for the June 30 release of the Acreage Report. Corn planted acres for the U.S. decreased from 89.9 million acres to 89.8 million acres after the resurvey, while soybean planted acres decreased from 88.3 million acres to 88 million acres. Minnesota reduced estimated corn planted acres from 8.3 million acres to 8.2 million acres, while North Dakota and South Dakota reported no changes in the resurvey and remain at 3 million acres of corn and 5.9 million acres of corn, respectively. For soybeans, Minnesota reported no changes in the resurvey and remains at 7.5 million acres of soybeans, while North Dakota reduced planted acres from 5.9 million acres in the June report to 5.7 million acres in the August update.
Click here to see more...