The decision of how to respond to a drought-produced forage shortage will always have short-term and possibly long-term financial impacts. Models, decision tools and budgets can assist ranchers with choosing a tactic that minimizes the negative financial outcome. The tactics usually used are depopulation and destocking. Depopulation means selling cows, heifer, yearlings and calves to fit the available forage. Destocking does not sell animals, but cattle are either moved to newly obtained pasture, rented or purchased, or purchased hay for the current herd size. Each of these two broad tactics has financial consequences.
Wyoming ag economists understood that the beef price cycle might also influence the financial outcome of the drought decision. Bastian et al. (2009) modeled the two choices Wyoming ranchers most often make during three- or four-year droughts with two different beef price cycles, peak-to-peak or trough-to-trough. For both drought lengths, purchasing feed results in negative returns for the peak-to-peak price cycle. Only in the trough-to-trough price cycle does purchased feed show positive returns. Comparing depopulation and purchased feed by drought length indicates that depopulation results in the highest net returns for either drought length. The Bastian et al. modeling also shows that the trough-to-trough price cycle results in higher returns than when a drought starts at the peak of the beef price cycle.
How to decide on an appropriate strategy?
The Bastian et al. (2009) study shows the need for ranchers to perform their own financial impact due diligence when droughts occur. Several tools can be used to assess which strategy to use including a spreadsheet, "Strategies for Cattle Herd During Drought," from Colorado State University. The spreadsheet compares three choices ranchers can make, buy feed, rent or buy pastures and sell cattle, to calculate possible financial results for each over several years. FinPack, a financial analysis program goes further, allowing the user to compare combinations of strategies or added enterprises during a drought. These combined strategies may perform better or differently than the Bastian et al. models and should be considered.
(Price) Risk management
There is an increasing need to manage risk regardless of whether a drought occurs. Production and price/market risk are two categories of risk that producers face. Declining pasture conditions due to drought, bomb cyclones, BSE, or a potential foot and mouth outbreak are examples of production risk. In the event that production reduces supply, feeder cattle prices will rise in the short run. Price risk, on the other hand, has little to do with the animals themselves and more to do with the market in which the animals are sold. These market conditions are often out of producer’s direct control. The US-China trade war, the Holcomb, Kan., packing plant fire, COVID-19 government restrictions and COVID-19 cases among packing plant workers are some examples of price risk events that have affected the cattle industry in the last two to three years. All of these dramatically affected consumer demand for beef and ultimately fed and feeder cattle. Figure 4 plots how feeder cattle futures markets have responded to select production and price risk events. As expected, production shocks temporarily raised feeder cattle prices whereas price risk events generally decreased feeder cattle prices. Depending upon the price risk shock, feeder cattle prices generally started to rise six weeks post event.
The 2020 growing season weather that produced drought conditions, like conditions in the Southwestern part of the United States, as well as in parts of western and central Nebraska, can impact prices received by producers. However, the probability of drought varies each year and an operation does not perfectly know when a drought will occur. Producers can mitigate some price risk through available risk management tools.
To illustrate, assume an operation in central Nebraska that sells 550 pound weaned steers and generally prices cattle in May for September delivery. All cattle that not priced are sold in the cash market at delivery. Assuming the producer can use five different price risk management tools (cash market sales only, hedging, “in the money” long put, “out of the money” long put, fence, or synthetic put, Table 1 displays how price risk management tools perform ($/cwt.) above the local NE cash price. Values that are greater than local cash prices are highlighted in green. On average, buying “in the money” puts yield a net price of $4.59 above NE local cash. Other strategies yield comparable outcomes. The multiyear drought in 2011 and 2012 caused feeder cattle prices to spike to historic highs in 2014. Excluding this year shows that a simple hedging strategy provided a similar return above local cash as buying “in the money” puts.
In summary, using available price risk management tools can effectively reduce some of the market price risk variability that is inherent in agricultural production that are caused by either production or price risk.
| Year | Hedge | Buy | Buy | Fence | Synth Put |
|---|
| | (Sell Futures) | ITM Put | OTM Put | | |
|---|
| 2010 | 4.38 | 4.64 | -1 | 0 | 3.38 |
|---|
| 2011 | 2.02 | 2.3 | -1 | 0 | 1.02 |
|---|
| 2012 | 12.51 | 12.6 | 5.6 | 6.6 | 11.51 |
|---|
| 2013 | -7.9 | -5 | -1 | -2.68 | -6.21 |
|---|
| 2014 | -44.81 | -5 | -1 | -39.02 | -6.79 |
|---|
| 2015 | 15.52 | 16.04 | 9.04 | 10.04 | 14.52 |
|---|
| 2016 | 9.78 | 10.37 | 3.37 | 4.37 | 8.78 |
|---|
| 2017 | -9.88 | -5 | -1 | -4.38 | -6.49 |
|---|
| 2018 | -7.3 | -5 | -1 | -2.02 | -6.28 |
|---|
| 2019 | 19.45 | 19.91 | 12.91 | 13.91 | 18.45 |
|---|
| | | | | | |
|---|
| Average | -0.62 | 4.59 | 2.49 | -1.32 | 3.19 |
|---|
| Exclude 2014 | 4.29 | 5.65 | 2.88 | 2.87 | 4.3 |
|---|
| Years Positive | 6 | 6 | 4 | 6 | 6 |
|---|
TABLE 1. Risk Management Analysis for Sample Operation in Central Nebraska
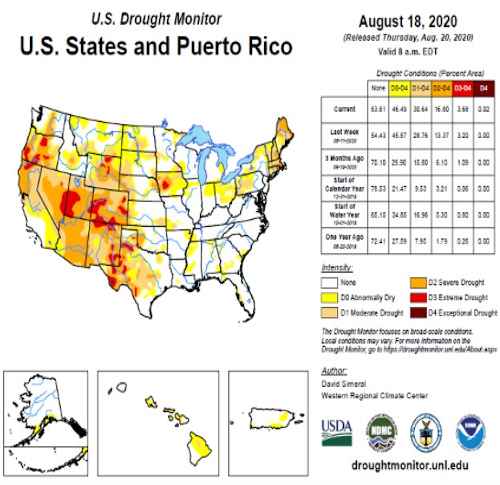
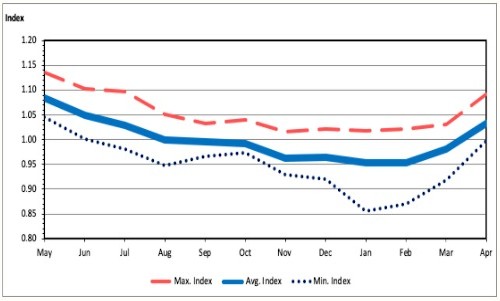
FIGURE 2. Seasonal Price Index for Alfalfa Hay
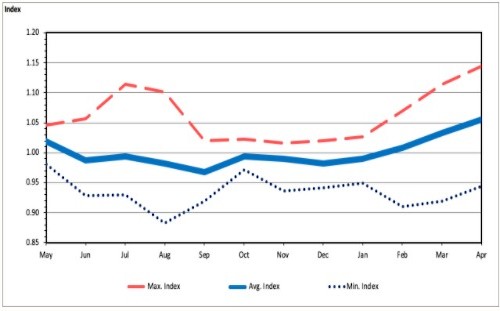
FIGURE 3. Seasonal Price Index for Other Hay
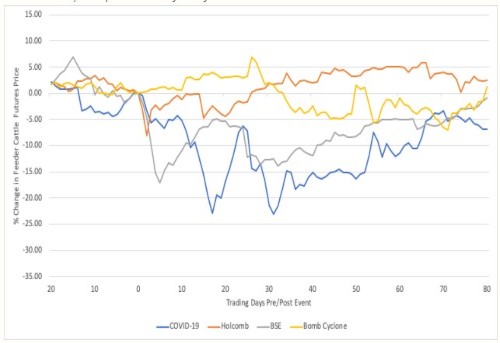
FIGURE 4. Change in Feeder Cattle Futures Prices Given Select Price and Production Shocks
Source : unl.edu