The version of the representative biodiesel model used here incorporates several key assumptions:
- 30 million gallon annual biodiesel production capacity.
- Plant construction cost of $1.57 per gallon of nameplate capacity.
- 50 percent debt and 50 percent equity financing.
- 25 percent interest on 10-year loan for debt financing, with the loan paid off in 2017.
- Plant operates at 100 percent of nameplate capacity.
- Plant only processes soybean oil into biodiesel.
- 9 pounds of glycerin co-product per gallon of biodiesel.
- 7 cubic feet of natural gas per gallon of biodiesel.
- Other variable input costs of 25 cents per gallon of biodiesel.
- Total fixed costs of 26 cents per gallon of biodiesel through 2017 and 20 cents per gallon thereafter.
This model is meant to be representative of an “average” plant constructed in 2007 to process soybean oil into biodiesel. There is certainly substantial variation in capacity, production efficiency, and feedstock across the industry and this should be kept in mind when viewing profit estimates from the model. However, limiting the feedstock to soybean oil is reasonable since it represents about half of the feedstock used to produce biodiesel in the U.S. and feedstock prices tend to be highly correlated.
In previous versions of the representative biodiesel plant model, a conversion factor of 7.55 pounds of soybean oil per gallon of biodiesel was assumed. Data on biodiesel production and feedstock use from the EIA’s Monthly Biodiesel Production Report were examined to determine whether biodiesel production efficiency has improved in recent years. Across all types of production feedstock (e.g., soybean oil, canola oil, animal fats) the average conversion rate was 7.50 over January 2017 through November 2020, slightly below the 7.55 conversion factor assumed in the original version of the model. The conversion efficiency did improve over this period, averaging 7.57 in 2017 compared to 7.51 in 2020. Based on this analysis of EIA data, the feedstock conversion rate in the model was dropped from 7.55 to 7.50 pounds starting in 2018.
In previous versions of the representative biodiesel plant model, it was assumed that 0.71 pounds of methanol were used per gallon biodiesel produced. The actual alcohol use per gallon reported by the EIA has been higher and increasing over time, rising from 0.77 pounds in 2017 to 0.83 pounds in 2020. Consequently, the methanol usage per pound of biodiesel production was increased for recent years. It was increased to 0.75 pounds in 2017, 0.80 pounds in 2018, and 0.84 pounds in 2019 through 2021. While the representative biodiesel plant has had some modest gains in feedstock efficiency in recent years, this has come at the cost of added methanol expenses.
To track plant profitability over time, weekly biodiesel and soybean oil prices at Iowa plants from the Agricultural Marketing Service (AMS) were collected starting in 2007. Natural gas costs over 2007 through March 2014 are based on monthly industrial prices for Iowa available from the EIA. Due to a change in the behavior of the industrial price series, starting in April 2014 natural gas costs are based on monthly electric power consumer prices for Iowa, also from the EIA. Glycerin and methanol prices are obtained from OPIS.
Analysis
Figure 1 presents the price of biodiesel—the main revenue component—on a weekly basis from January 26, 2007 through January 21, 2022. The figure reveals that biodiesel prices skyrocketed in the first half of 2021, reaching an all-time high (since 2007) of $6.11 per gallon in mid-June. Prices then slid back towards $5 per gallon the remainder of the year, which was still a very high price by historical standards. Glycerin is the other biodiesel revenue component and Figure 2 shows that its price truly went linear in 2021. Glycerin prices reached the historically unprecedented level of $0.65 per pound in November. Traditionally, by-product revenue from glycerin was only a few cents, but prices in 2021 reached such a high level that it became a meaningful component of revenue for part of the year.
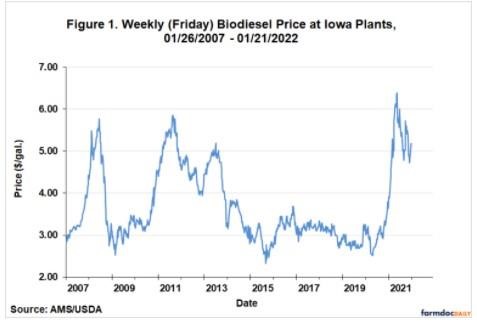
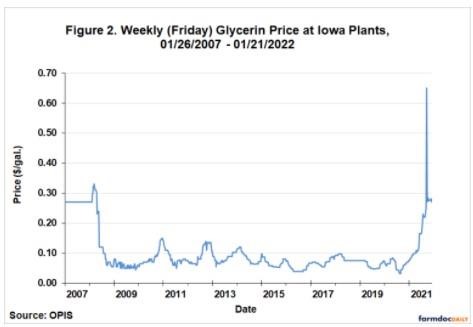
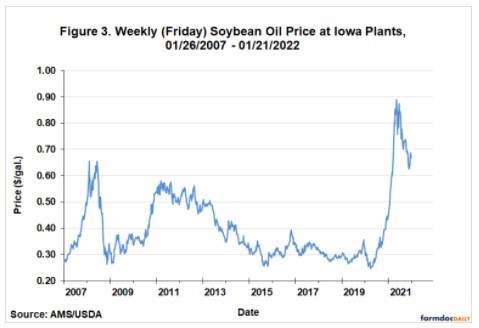
Figure 3 presents the price of soybean oil—the main cost component—on a weekly basis for the same time period. This figure shows that soybean oil prices skyrocketed right along with biodiesel prices during the first half of 2021, reaching the stunningly high level of $0.89 per pound in early June. Soybean oil prices then dropped under $0.70 by the end of the year.
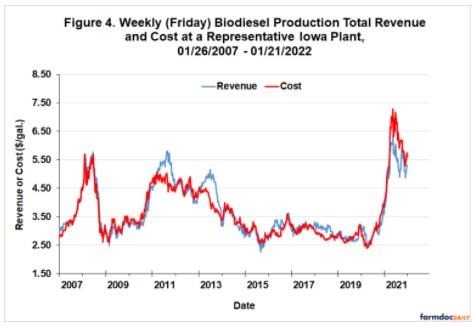
The picture that emerges is rapidly rising revenue and costs for biodiesel producers in 2021. Since it is not possible to determine whether biodiesel or soybean oil price movements dominated in 2021 simply by looking at Figures 1 and 2, total revenue and cost for the representative biodiesel plant are shown in Figure 4. Note that revenue is dominated by the price of biodiesel (minus netback charges), while cost is the sum of all variable and fixed costs. Of course, the cost of soybean oil dominates the cost side of the ledger. The figure indicates that revenue and cost were not terribly different during the first half of 2021, but for the remainder of the year cost was substantially above revenue. Interestingly, during this period of large losses, biodiesel revenue reached an all-time high (since 2007) of $6.42 per gallon.
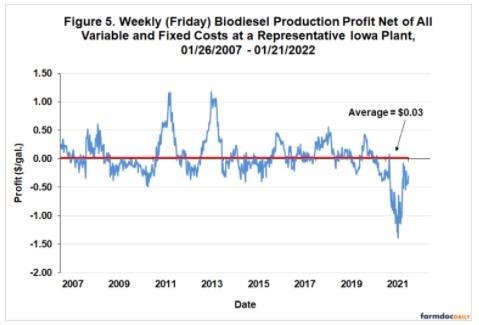
Weekly biodiesel production profits (pre-tax) net of all variable and fixed costs are shown in Figure 5. This is simply the difference between revenue and cost presented in Figure 4. The representative plant is estimated to have operated in the red for virtually the entirety of 2021. However, losses for the first quarter were at least within the range of historical experience. The bottom literally fell out starting in April as soybean oil prices raced far ahead of biodiesel prices. In August, losses reached the unheard level of -$1.39 per gallon, which was obviously a new record low for this data set. Losses did lessen substantially during the fall but tailed off once again towards the end of the year. The average net loss estimated for the entire calendar year in 2021 was -$0.61 per gallon, which dwarfs the historical average profit of $0.03.
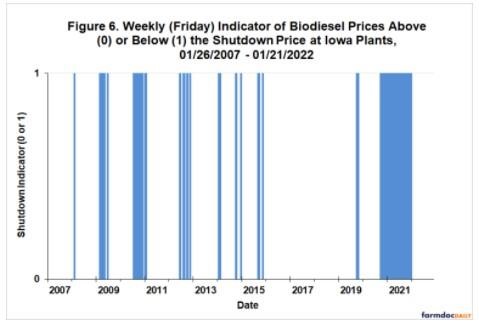
It is clear that biodiesel production losses were severe in 2021. The severity is illustrated in a different manner in Figure 6, which presents an indicator of whether the biodiesel price at the representative Iowa plant were above or below the shutdown price. We define the shutdown price to be a biodiesel price net of marketing costs that is not high enough to cover variable costs of production net of glycerin revenue. In the chart, a zero indicates that the biodiesel price was above the shutdown price and a one indicates that the price was below the shutdown price. Hence, periods covered by blue shaded area are periods when the representative plant was in shutdown territory. There have clearly been several extended periods since 2007 when biodiesel plants were faced with economic conditions favoring shutdown instead of producing. However, the length of the shutdown period that started in October 2020 is simply unprecedented. With the exception of four weeks (not visible in Figure 6), the representative plant is estimated to have operated with biodiesel prices below the shutdown level for almost 15 consecutive months between October 2020 and December 2021.
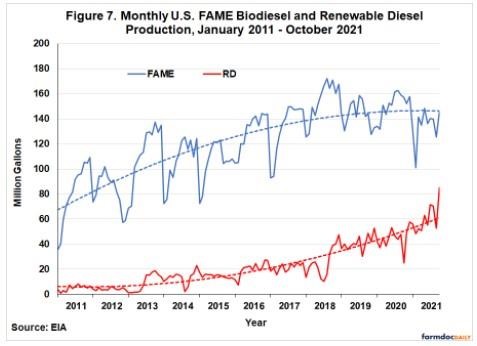
The direct source of the historically unprecedented losses for biodiesel producers in 2021 is not hard to locate. As noted earlier, the reason is surging soybean oil prices that outpaced gains in biodiesel prices (see Figure 3). It is important to recognize that this is unusual market behavior. Our previous research indicates that soybean oil prices lead (or “cause”) biodiesel prices at the weekly time horizon (farmdoc daily, September 10, 2015). In the past, increases in soybean oil prices have generally led to increases in biodiesel prices that at least allow producers to breakeven. Since mid-2020, all signs point to a policy-driven boom in renewable diesel production as the underlying culprit behind the surging soybean oil prices, and hence, the losses for biodiesel producers. Figure 7 shows monthly production of biodiesel (FAME) and renewable diesel over January 2011 through October 2021, the latest available data. The divergent trends in the two series are obvious. Renewable diesel production is surging while biodiesel production is declining. For example, on a year-over-year basis, renewable diesel production was up 37 percent from November 2020-October 2021 while biodiesel production was down 6 percent. There is no doubt that renewable diesel is rapidly gaining market share from biodiesel. In simplest terms, renewable diesel producers are outbidding biodiesel producers for the feedstock inputs.
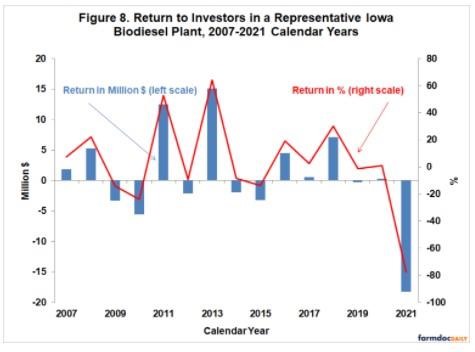
Further perspective on the devasting losses of biodiesel producers in 2021 is provided by aggregating profit margins to an annual horizon. Figure 8 shows total annual (pre-tax) profits net of variable and fixed costs for each calendar year between 2007 and 2021. Profits are presented in terms of both total net returns and percent return to equity. The total loss of the representative biodiesel plant in 2021 was a staggering -$18.3 million, or a return to equity of -77.5 percent. Not only was this the third consecutive year of negative annual profits, but the 2021 loss equaled 40 percent of all of the profits earned by the representative plant in previous years. With the addition of 2021 losses, the total cumulative (pre-tax) return to equity holders for the 2007-2021 period stands at only $12.2 million, $11.4 million less than the assumed original equity investment for the plant of $23.6 million. We can also use the average net loss for the representative plant to make a rough estimate of the loss for the entire U.S. biodiesel industry in 2021. Assuming all plants in the industry earned a net profit of -$0.61 per gallon and total biodiesel production for the U.S. in 2021 was 1.618 billion gallons, this implies aggregate industry losses of -$987 million.
The average percent return to equity holders provides useful information on the performance of biodiesel plants relative to other investments. The average return was 3.5 percent over 2007-2021 and the standard deviation, a measure of risk, was 33.5 percent. By comparison, the average return for the stock market over this period, as measured by the S&P 500, was 12.1 percent and the associated standard deviation was 17.5 percent. The ratio of average return to standard deviation provides one measuring stick of an investment’s return-risk attractiveness, and on this measure the ratio for biodiesel investment, 0.10, is substantially lower than the stock market as a whole, 0.69. There is no doubt that the devastating losses in 2021 severely damaged the attractiveness of biodiesel plants as an investment.
Finally, it is important to note that the annual profit estimates do not take into account revenue from retroactively reinstated biodiesel tax credits. In response to the retroactive reinstatement of the $1 per gallon blenders tax credit in several years during the sample, sharing clauses in marketing contracts may have been invoked between biodiesel producers and blenders. These clauses specify how the biodiesel tax credit will be shared between the biodiesel producer and blender if the tax credit is not in place at the time a transaction is made but retroactively reinstated at some later date. There is no public data on the exact nature of the sharing provisions or the frequency that such provisions are put in place. Anecdotal evidence suggests sharing provisions are widespread and that the typical split of the $1 per gallon credit is 50/50. We have previously shown (e.g., farmdoc daily, February 5, 2020) that this additional tax credit revenue, garnered through sharing agreements with blenders, can yield a more positive long-term picture of the profitability of U.S. biodiesel production.
Implications
We estimate that the average net loss in 2021 for a representative Iowa biodiesel plant was -$0.61 per gallon, which dwarfs the historical average profit of $0.03. This translates into a staggering loss of -$18.3 million for the year, or a return to equity of -77.5 percent. This loss wipes out 40 percent of all profits earned over 2007-2020. The driving force behind the devastating losses was skyrocketing soybean oil prices that outpaced gains in biodiesel prices. All signs point to a policy-driven boom in renewable diesel production as the underlying culprit behind the surging soybean oil prices, and hence, the losses for biodiesel producers. It is clear that the recent level of losses is unsustainable. In fact, it is not clear why biodiesel production held up as well as it has during 2021. One possibility is that biodiesel producers had a source of revenue we did not account for in the analysis, such as COVID relief funds. The other possibility is that the industry grimly hung on through 2021 in the face of the onslaught from renewable diesel production and it is only a matter of time before more biodiesel plants are forced to shut down.
Source : illinois.edu