The bi-weekly Illinois Production Cost Report provided by the Agricultural Marketing Service (AMS) of the United States Department of Agriculture (USDA) reports average prices for fertilizer products and farm diesel fuel based on statewide surveys. The report also includes the price range for survey responses, providing a measure of price variability within the state for fertilizers and diesel fuel over the two-week period covered by the report. Note that there are both spatial and temporal components to this variation. The price range reported captures variation across price information sources or respondents, as well as variation that could occur during the timeframe over which the data is collected to create the report.
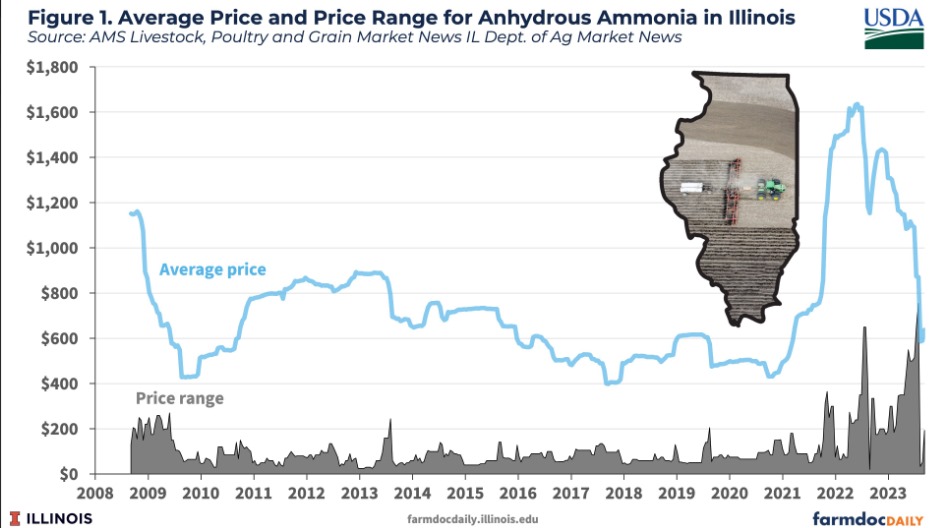
Figure 1 compares the average price for anhydrous ammonia over the last 15 years (September 4, 2008 to September 7, 2023) to the range in prices observed to compute the reported average. For example, the most recent September 7, 2023 report listed the average price of anhydrous ammonia in Illinois at $637/ton with a price range of $193/ton ($567 to $760 per ton).

Price variability implied by the reported price range has been notably higher over the past two years as nitrogen fertilizer prices increased dramatically from late 2020 into the 2nd quarter of 2022 followed by a sharp decline to current levels. Since 2020, the price range reported in the USDA AMS reports has averaged $193 per ton and exceeded $500 per ton over multiple weeks in both 2022 and 2023. Variability was also relatively high during the period of sharp fertilizer price declines from late 2008 through 2009 with an average price range of nearly $160/ton. Variability was lower from 2010 through 2019, with an average price range of $76/ton.
The ratio of the reported price range to the average price provides a relative measure of price variability. Since 2020 this ratio has averaged 21%. From late 2008 through 2009 it averaged 22%. From 2010 through 2019 it averaged just 12%.
For anhydrous ammonia, price variability around the average and price variability relative to the average price were markedly higher in 2008/2009 and in the period since 2020 compared with the decade from 2010 through 2019. The higher price variability periods were both associated with heightened levels of market uncertainty and general energy and commodity price volatility. High commodity prices fueled by global demand growth coupled with high input costs and fertilizer supply chain issues and the effects of the global financial crisis led to increased price volatility in the mid- to late-2000s (Huand et al., 2009). The recent period of increased price variability stems from volatile energy and commodity markets during and following the pandemic as well as additional uncertainty and supply chain challenges introduced by the ongoing Russia-Ukraine conflict (February 28, 2023).
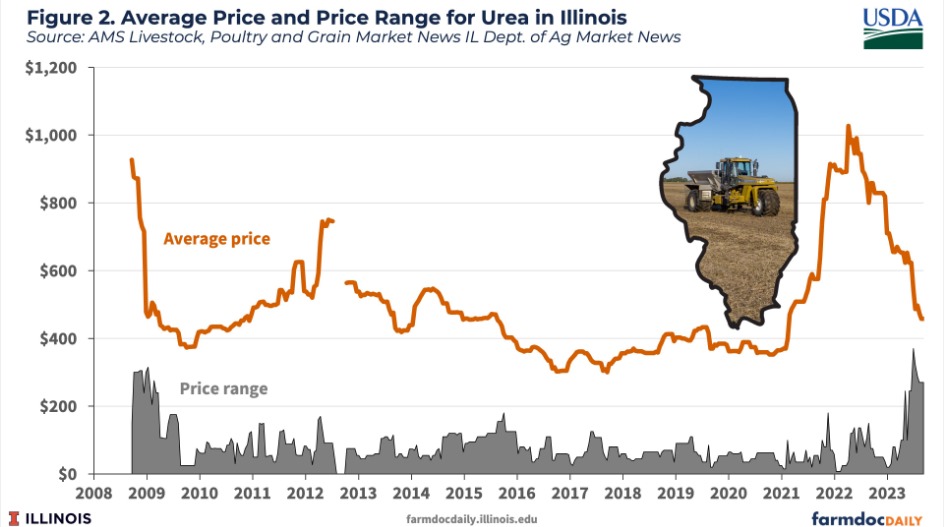
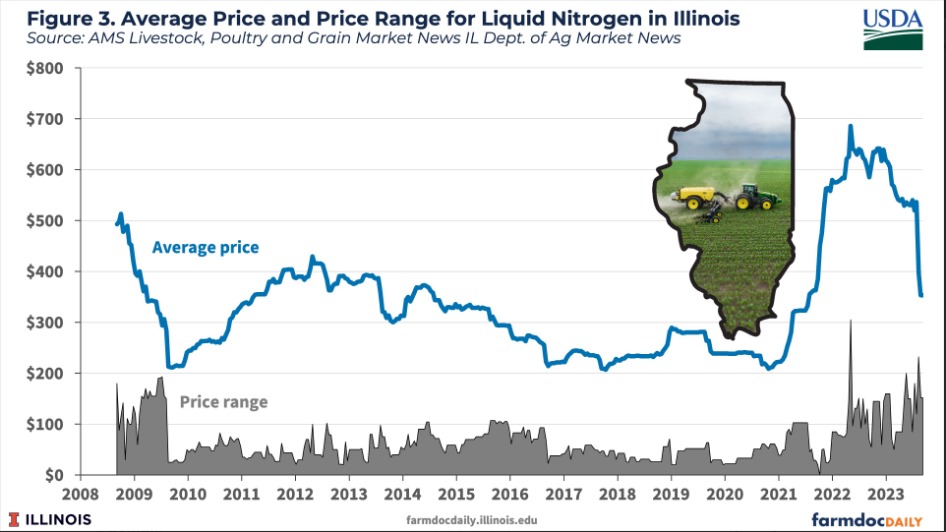
Figures 2 and 3 illustrate the average price and price range measures for urea and liquid nitrogen over the same time period. Variability (relative variability) in urea prices in Illinois averaged $162/ton (31%) from late 2008 through 2009, $75/ton (18%) from 2010 through 2019, and $80/ton (14%) since 2020. Variability (relative variability) in liquid prices in Illinois averaged $106/ton (30%) from late 2008 through 2009, $54/ton (18%) from 2010 through 2019, and $84/ton (20%) since 2020. Both urea and liquid nitrogen prices exhibited larger nominal price variability during the 2008/2009 and 2020 to current periods, consistent with anhydrous ammonia. However, the relative measure of price variability for liquid nitrogen since 2020 was not significantly greater than from 2010 to 2019, and recent relative variability for urea has actually been a bit lower than the average from 2010 to 2019.


Source : illinois.edu