By Gary Schnitkey and Nick Paulson et.al
Department of Agricultural and Consumer Economics
University of Illinois
By Carl Zulauf
Department of Agricultural, Environmental and Development Economics
Ohio State University
Previous articles on Enhanced Coverage Option (ECO) provide a description of the product (farmdoc daily,
November 24, 2020), evaluate the size of premiums (farmdoc daily,
December 8, 2020), and give historical frequencies of payments (farmdoc daily,
December 10, 2020). Herein we illustrate the years in which ECO and Supplemental Coverage Option (SCO) will make payments for a northern Illinois county (DeKalb), a central Illinois county (McLean), and a southern Illinois county (Saline). While ECO will trigger in many years, those years will vary across the state. Moreover, ECO may not make payments for several years in a row.
Background
ECO and SCO are county-level products that will make payments when actual county revenue is below expected county revenue. Expected county revenue equals:
Expected county yield x the higher of the projected price and higher price
The expected county yield is released by the Risk Management Agency (RMA) each year, with 2021 expected yields already released. The projected price for corn is based on the December Chicago Mercantile Exchange Contract (CME) settlement prices during February. As a result, projected prices will not be known until the end of February. The harvest price is the settlement prices of the December contract during October.
Actual county revenue will equal actual county yield times harvest price. County yields will be released by RMA in June in the year following production. As a result, ECO and SCO payments for 2021 will not be known until June 2022.
Estimates of Actual Revenue as a Percent of Expected County Revenue
We estimated the actual county revenue as a percent of expected county revenue, hereafter referred to as the actual-to-expected revenue percent. The actual-to-expected revenue percent can then be compared to ECO and SCO’s coverage levels to see if that product will make a payment. Three coverage levels are important:
- 95% — Farmers have the option to purchase ECO from 95% down to 86%.
- 90% — Famers have the option to purchase ECO from 90% to 86%. Farmers can choose either 95% (option 1) or 90%.
- 86% — Farmers can purchase SCO from 86% down to the underlying COMBO product’s coverage level. In the examples presented here, we use the Revenue Protection (RP) plan to illustrate payments as RP is the most used crop insurance product in Illinois.
Take, as an example, an actual-to-expected revenue percent of 88%. Given an 88% percent actual-to-expected revenue, ECOs at 95% and 90% coverage levels would trigger payments. Since SCO coverage begins at an 86% coverage level, 88% would not trigger a SCO payment.
Actual-to-expected revenue percentages were calculated from 1990 to 2019 using data described in the December 8th farmdoc daily article. Note that these are simulated payments. ECO did not exist in these years. Moreover, we estimated expected county yields using linear trend models, which will not precisely match RMA’s procedures. Still, results should be fairly representative of actual results.
We will show percentages for Revenue Protection (RP). Percentages and payments will vary if other plans in the COMBO product are selected.
Dekalb County
DeKalb County is located in northern Illinois and is a relatively high-yielding county. DeKalb County’s expected county yield for 2021 is about 204 bushels per acre. The standard deviation of yields since 1990 is 26 bushels per acre.
Actual-to-expected revenue percentages are shown in Figure 1 for corn in DeKalb County. These percentages will be the same for all farmers in the county because county revenue is used in indemnifying ECO and SCO.

Interpretation of the graph is illustrated by explaining percentages in recent years:
- 2019: The actual-to-expected revenue percent is 91%. ECO 95% would have made a payment. This payment’s size increases as the actual-to-expected revenue percent are further away from the 95% coverage level. Neither ECO 90% nor SCO would make payments.
- 2018: The actual-to-expected percentage is 94%. ECO 95% would make a small payment. Neither ECO 90% nor SCO would make payments,
- 2017: The actual-to-expected percent is 85%. ECO 95% and 90% would make payments. In both cases, the maximum ECO payments would be received because 85% is below 86%, ending the ECO coverage level. SCO would make a payment because 85% is below the 86% coverage level offered by SCO. The SCO payment would be small.
- 2016: The actual-to-expected revenue percent is well above 95%. No county product would make a payment in 2016.
Any time the actual-to-expected county revenue is below 95%, ECO at the 95% coverage level will make a payment. From 1990 to 2019, this occurred 25 times, or in 83% of the cases (see maps in the December 8th farmdoc daily article). ECO 95% will make the maximum payment when the actual-to-expected county revenue is below 86%, which are the red and brown shaded areas in Figure 1. This occurred in 13 cases. Roughly one-half the time, ECO 95% will make the maximum payment.
McLean County
McLean County is located in central Illinois. McLean County expected yield for 2021 is 210 bushels per acre, slightly higher than DeKalb County. Between 1990 and 2019, the standard deviation of McLean County yield has been 32 bushels per acre, higher than DeKalb County.
Results for McLean County are shown in Figure 2. A major difference between McLean and DeKalb counties occurs in the later years of the analysis. McLean County farmers would not have received a payment from 2016 onwards, while DeKalb County would have received payments in three of those years. In recent years, McLean County has had exceptional yields, resulting in no payments on county products. This series illustrates that ECO payments may not occur for many years even at the highest coverage level.

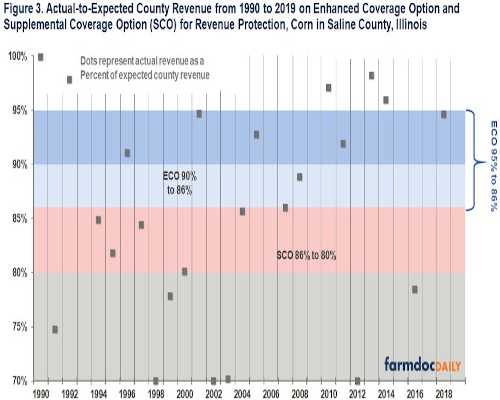
Saline County
Saline County is located in southern Illinois. Saline County’s expected yield for 2021 is 165 bushels per acre, lower than either DeKalb or McLean Counties. The standard deviation of yields is 36 bushels per acre, higher than either DeKalb or McLean Counties.
Saline County has a different set of payments than do the other two counties. Since 2012, ECO 95% only made payments in 2 years: 2016 and 2018. The 2018 payment is fairly small such that ECO at the 90% coverage level would not make a payment.
Summary
ECO at the 95% and 90% coverage levels will make payments in many years. Still, it is possible that an extended period could occur between years of payments.