Overview
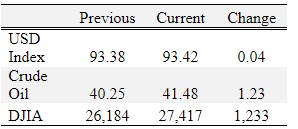
Corn, soybeans, and wheat were down; cotton was mixed for the week.
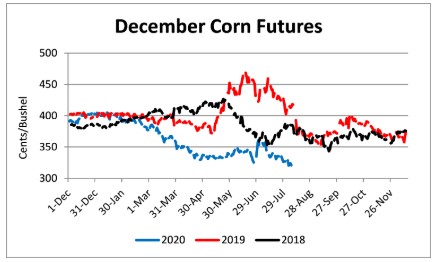
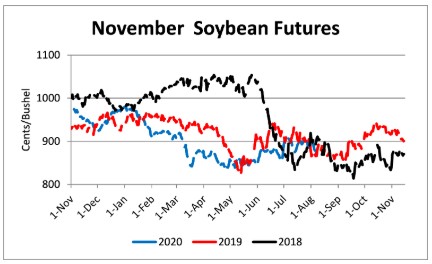
With harvest rapidly approaching in Tennessee producers should make sure they have prepared machinery and storage for harvest, estimated their production, and evaluate where they stand from a marketing standpoint. Unfortunately, 2020 has not provided attractive prices for in-season marketing of corn and soybeans. January was the only month this year that new crop corn futures were above $4.00 and soybean futures were above $9.50. That was before the COVID-19 pandemic created demand disruptions and 2020’s production was still very uncertain.
Prices declined rapidly from the end of January through April due to the COVID-19 pandemic. After planting, good crop conditions and continued demand uncertainty moved prices mostly sideways to lower. In fact, after planting, there was only one major rally in corn and soybean futures, June 30 to July 10. The rally was short lived as corn went from $3.30 to $3.60 before falling quickly back below $3.40 and soybeans went from $8.60 to $9.10 before retreating below $9.00.
As a result of the lack of pricing opportunities, many producers have no or a small portion of their 2020 production priced. Now is the time for producers to quantify how many bushels they have priced for harvest delivery and the amount of on-farm or off-farm storage (plus associated costs) available to their operation. This will allow them to determine how much crop will need to be priced between now and the end of harvest. Additionally, producers should be looking at delivery locations in their area and actively seeking out attractive basis offerings. A substantial rally in futures prices during harvest seems unlikely given the current circumstances so marketing attentiveness will be needed to extract any available price premiums.
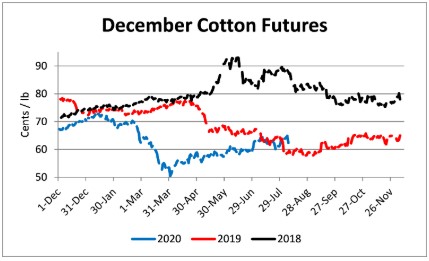
On Thursday cotton futures briefly exceeded 65 cents before falling 2.5 cents of Friday. Cotton’s long-term trend has been up, but it may be difficult for cotton to exceed and hold the 65-cent level. Establishing a price floor when prices exceed 64 cents should be afford consideration.
Corn
Ethanol production for the week ending July 31 was 0.931 million barrels per day, down 27,000 barrels from the previous week. Ethanol stocks were 20.346 million barrels, up 0.074 million barrels compared to last week. Corn net sales reported by exporters for July 24-30 were up compared to last week with net sales of 4.0 million bushels for the 2019/20 marketing year and 102.4 million bushels for the 2020/21 marketing year. Exports for the same time period were down 29% from last week at 27.0 million bushels. Corn export sales and commitments were 97% of the USDA estimated total exports for the 2019/20 marketing year (September 1 to August 31) compared to the previous 5-year average of 103%. Across Tennessee, average corn basis (cash price-nearby futures price) weakened at Mississippi River and West Tennessee elevators and barge points and remained unchanged at Northwest and North-Central elevators and barge points. Overall, basis for the week ranged from 5 over to 15 over, with an average of 10 over the September futures. September 2020 corn futures closed at $3.07, down 9 cents since last Friday. For the week, September 2020 corn futures traded between $3.07 and $3.18. Sep/Dec and Sep/Mar future spreads were 13 and 25 cents.
| Sep 20 | Change | Dec 20 | Change |
Price | $3.07 | -$0.09 | $3.20 | -$0.07 |
Support | $3.04 | -$0.08 | $3.17 | -$0.06 |
Resistance | $3.13 | -$0.07 | $3.25 | -$0.05 |
20 Day MA | $3.21 | -$0.08 | $3.30 | -$0.08 |
50 Day MA | $3.29 | -$0.01 | $3.38 | -$0.01 |
100 Day MA | $3.31 | -$0.03 | $3.40 | -$0.03 |
4-Week High | $3.55 | $0.00 | $3.62 | -$0.01 |
4-Week Low | $3.07 | -$0.07 | $3.20 | -$0.05 |
Technical Trend | Down | = | Down | = |
Nationally the Crop Progress report estimated corn condition at 72% good-to-excellent and 7% poor-to-very poor; corn silking at 92% compared to 82% last week, 72% last year, and a 5-year average of 87%; and corn dough at 39% compared to 22% last week, 20% last year, and a 5-year average of 33%. In Tennessee, the Crop Progress report estimated corn condition at 72% good-to-excellent and 6% poor-to-very poor; corn silking at 94% compared to 87% last week, 96% last year, and a 5-year average of 97%; and corn dough at 59% compared to 43% last week, 75% last year, and a 5-year average of 78%. In Tennessee, new crop cash corn contracts ranged from $2.99 to $3.35. December 2020 corn futures closed at $3.20, down 7 cents since last Friday. Downside price protection could be obtained by purchasing a $3.20 December 2020 Put Option costing 12 cents establishing a $3.08 futures floor. March 2021 corn futures closed at $3.32, down 6 cents since last Friday.
Soybeans
Net sales reported by exporters were down compared to last week with net sales of 12.7 million bushels for the 2019/20 marketing year and 51.6 million bushels for the 2020/21 marketing year. Exports for the same period were up 32% compared to last week at 29.9 million bushels. Soybean export sales and commitments were 105% of the USDA estimated total annual exports for the 2019/20 marketing year (September 1 to August 31), compared to the previous 5-year average of 103%. Across Tennessee, average soybean basis weakened at Mississippi River, West, West-central and North-central elevators and barge points and strengthened at Northwest elevators and barge points. Basis ranged from 4 under to 31 over the September futures contract. Average basis at the end of the week was 22 over the September futures contract. September 2020 soybean futures closed at $8.65, down 25 cents since last Friday. For the week, September 2020 soybean futures traded between $8.64 and $8.96. Sep/Nov and Sep/Jan future spreads were 2 and 9 cents. September soybean-to-corn price ratio was 2.82 at the end of the week.
Soybeans | Sep 20 | Change | Nov 20 | Change |
Price | $8.65 | -$0.25 | $8.67 | -$0.25 |
Support | $8.57 | -$0.19 | $8.58 | -$0.19 |
Resistance | $8.79 | -$0.14 | $8.84 | -$0.11 |
20 Day MA | $8.86 | -$0.04 | $8.88 | -$0.05 |
50 Day MA | $8.77 | $0.03 | $8.82 | $0.03 |
100 Day MA | $8.65 | $0.01 | $8.69 | $0.01 |
4-Week High | $9.04 | -$0.01 | $9.09 | -$0.03 |
4-Week Low | $8.64 | -$0.04 | $8.66 | -$0.05 |
Technical Trend | Down | - | Down | - |
Nationally the Crop Progress report estimated soybean condition at 73% good-to-excellent and 6% poor-to-very poor; soybeans blooming at 85% compared to 76% last week, 68% last year, and a 5-year average of 82%; and soybeans setting pods at 59% compared to 43% last week, 32% last year, and a 5-year average of 54%. In Tennessee, soybean condition was estimated at 72% good-to-excellent and 6% poor-to-very poor; soybeans blooming at 73% compared to 62% last week, 75% last year, and a 5-year average of 81%; and soybeans setting pods at 45% compared to 35% last week, 50% last year, and a 5-year average of 56%. In Tennessee, new crop soybean cash contracts ranged from $8.67 to $9.25. Nov/Dec 2020 soybean-to-corn price ratio was 2.71 at the end of the week. November 2020 soybean futures closed at $8.67, down 25 cents since last Friday. Downside price protection could be achieved by purchasing an $8.70 November 2020 Put Option which would cost 20 cents and set an $8.50 futures floor. January 2021 soybean futures closed at $8.74, down 24 cents since last Friday.
Cotton
Net sales reported by exporters were up compared to last week with net sales cancellations of 68,500 bales for the 2019/20 marketing year and net sales of 130,800 bales for the 2020/21 marketing year. Exports for the same time period were up 8% compared to last week at 346,800 bales. Upland cotton export sales were 120% of the USDA estimated total annual exports for the 2019/20 marketing year (August 1 to July 31), compared to the previous 5-year average of 108%. Delta upland cotton spot price quotes for August 6 were 60.91 cents/lb (41-4-34) and 63.16 cents/lb (31-3-35). Adjusted World Price (AWP) increased 1.73 cents to 49.44 cents.
Cotton | Dec 20 | Change | Mar 21 | Change |
Price | 62.36 | -0.30 | 63.19 | -0.06 |
Support | 60.41 | -0.83 | 61.23 | -0.56 |
Resistance | 65.85 | 1.83 | 66.53 | 1.86 |
20 Day MA | 62.61 | 0.05 | 63.30 | 0.07 |
50 Day MA | 61.33 | 0.59 | 61.99 | 0.57 |
100 Day MA | 58.75 | 0.17 | 59.57 | 0.15 |
4-Week High | 65.05 | 0.15 | 65.70 | 0.31 |
4-Week Low | 59.51 | 0.00 | 60.26 | 0.00 |
Technical Trend | Up | + | Up | + |
Nationally, the Crop Progress report estimated cotton condition at 45% good-to-excellent and 16% poor-to-very poor; cotton squaring at 91% compared to 84% last week, 92% last year, and a 5-year average of 91%; and cotton setting bolls at 54% compared to 42% last week, 55% last year, and a 5-year average of 55%. In Tennessee, cotton condition was estimated at 67% good-to-excellent and 13% poor-to-very poor; cotton squaring at 90% compared to 86% last week, 94% last year, and a 5-year average of 95%; and cotton setting bolls at 67% compared to 42% last week, 60% last year, and a 5-year average of 68%. December 2020 cotton futures closed at 62.36, down 0.3 cents since last Friday. For the week, December 2020 cotton futures traded between 62.15 and 65.05 cents. Dec/Mar and Dec/Dec cotton futures spreads were 0.34 cent and 0.83 cent. Downside price protection could be obtained by purchasing a 63 cent December 2020 Put Option costing 3.25 cents establishing a 59.75 cent futures floor. March 2021 cotton futures closed at 63.19 cents, up 0.22 cents since last Friday. December 2021 cotton futures closed at 62.7 cents, down 0.06 cents since last Friday.
Wheat
Wheat net sales reported by exporters were down compared to last week with net sales of 22.2 million bushels for the 2020/21 marketing year. Exports for the same time period were up 18% from last week at 22.0 million bushels. Wheat export sales were 40% of the USDA estimated total annual exports for the 2020/21 marketing year (June 1 to May 31), compared to the previous 5-year average of 39%.
Wheat | Sep 20 | Change | Jul 21 | Change |
Price | $4.95 | -$0.36 | $5.21 | -$0.28 |
Support | $4.83 | -$0.37 | $5.10 | -$0.27 |
Resistance | $5.09 | -$0.30 | $5.32 | -$0.19 |
20 Day MA | $5.25 | -$0.01 | $5.40 | $0.01 |
50 Day MA | $5.12 | -$0.01 | $5.31 | $0.00 |
100 Day MA | $5.23 | $0.00 | $5.35 | $0.00 |
4-Week High | $5.51 | $0.00 | $5.54 | $0.00 |
4-Week Low | $4.90 | $0.03 | $5.14 | $0.05 |
Technical Trend | Down | - | Down | = |
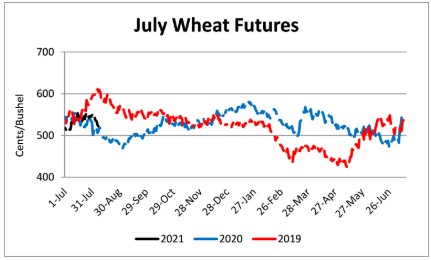
Nationally the Crop Progress report estimated winter wheat harvested at 85% compared to 81% last week, 80% last year, and a 5-year average of 88%; spring wheat condition at 73% good-to-excellent and 5% poor-to-very poor; and spring wheat harvested at 5% compared to 1% last week, 2% last year, and a 5-year average of 10%. In Tennessee, August 2020 wheat cash contracts ranged from $5.10 to $5.26. September 2020 wheat futures closed at $4.95, down 36 cents since last Friday. September 2020 wheat futures traded between $4.90 and $5.28 this week. September wheat-to-corn price ratio was 1.61. Sep/Dec and Sep/Jul future spreads were 8 and 26 cents. December 2020 wheat futures closed at $5.03, down 35 cents since last Friday. December wheat-to-corn price ratio was 1.57. July 2021 wheat futures closed at $5.21, down 28 cents since last Friday. Downside price protection could be obtained by purchasing a $5.30 July 2021 Put Option costing 36 cents establishing a $4.94 futures floor.
Source : tennessee.edu