As noted above, input price changes in production agriculture and other industries are due to general inflation and its mechanisms as well as supply and demand fundamentals specific to a particular input. Having said that, some inputs are more closed aligned or correlated with general inflation than other inputs.
Using information for the 1973 to 2022 period from the Federal Reserve Bank of St. Louis on inflation rates and farm input price indices from USDA-NASS, we examined the correlation between the implicit price deflator for personal consumption expenditures and agricultural production items (i.e., general input price index for production agriculture), feed, seed, fertilizer, fuels, labor, and machinery. The correlation coefficient between the implicit price deflator and agricultural production items was 0.611. The average annual rate of change over the period was slightly higher (3.9 percent) than the rate of change for the implicit price deflator (3.4 percent). The average annual price changes for labor (4.4 percent) and machinery (5.6 percent) were significantly higher than the average increase in the implicit price deflator. In terms of the six specific input categories examined, the only correlation between the implicit price deflator and the input price change that was not significantly different from zero was the correlation between the implicit price deflator and feed prices. The correlations between the implicit price deflator, and labor and machinery were relatively higher than the correlation between the implicit price deflator and general farm price index (i.e., agricultural production items). This is an important result because it suggests that input prices for labor and machinery more closely follow trends in general inflation than input prices for items such as feed, seed, fertilizer, and fuels.
Relative variability can be measured using the coefficient of variation which is computed by dividing the standard deviation by the average. The coefficient of variation for the rate of change in agricultural production items was 81 percent higher than the coefficient of variation for the implicit price deflator. The coefficients of variation for feed, fertilizer, and fuels were higher than the coefficient of variation for the more general farm input price index (i.e., agricultural production items). The coefficient of variation for the input price index for labor was smaller than the coefficient of variation for general inflation.
Historical Trends in General Inflation and Farm Input Prices
This section compares and contrasts the 1-year, 5-year, and 10-year averages for the implicit price deflator for personal consumption expenditures and farm input prices. Data for the implicit price deflator was obtained from the Federal Reserve Bank of St. Louis. Data for all of the farm inputs except fertilizer and diesel were obtained from USDA-NASS. Fertilizer and diesel price data were obtained from USDA-AMS.
Table 1 presents the average price changes for inflation and farm inputs for 2022, for the 2018 to 2022 period, and for the 2013 to 2022 period. The first thing that becomes immediately apparent is how much higher inflation was in 2022 compared to the 5-year and 10-year averages. The 10-year average inflation rate was only 2.1 percent.
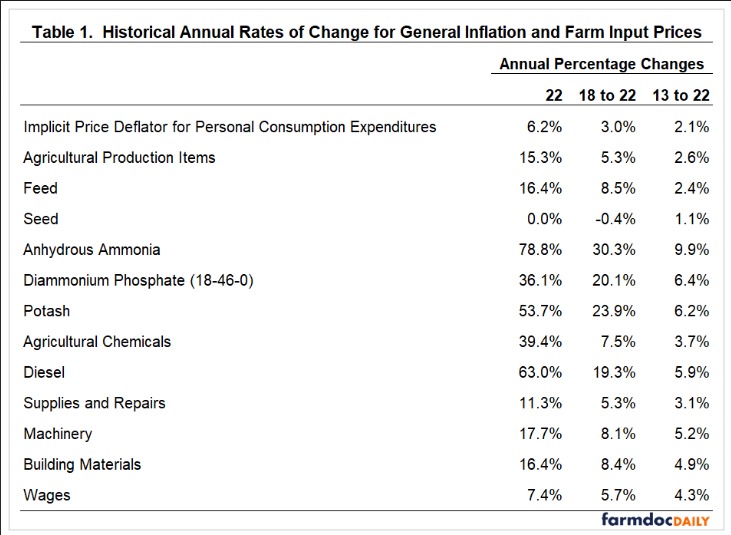
Now let’s compare the rate of general inflation to annual farm input price changes. For the annual change from 2021 to 2022 (labeled 2022 in Table 1), the input price changes for all of the farm inputs except for seed were higher than the annual change in the implicit price deflator. Annual price changes for energy and fertilizer were particularly large. The annual price change for diesel was 63 percent. The annual price changes for fertilizer ranged from 36 percent for diammonium phosphate to 79 percent for anhydrous ammonia. Turning to the 10-year averages, the only farm input with a price change smaller than the rate of change for the implicit price deflator was seed. The 10-year input price increases for machinery, diesel, potash, phosphate, and anhydrous ammonia exceeded 5 percent. The results in Table 1 illustrate how much of an outlier the price changes in 2022 were compared to the long-run averages.
Recent Trends in General Inflation and Farm Input Prices
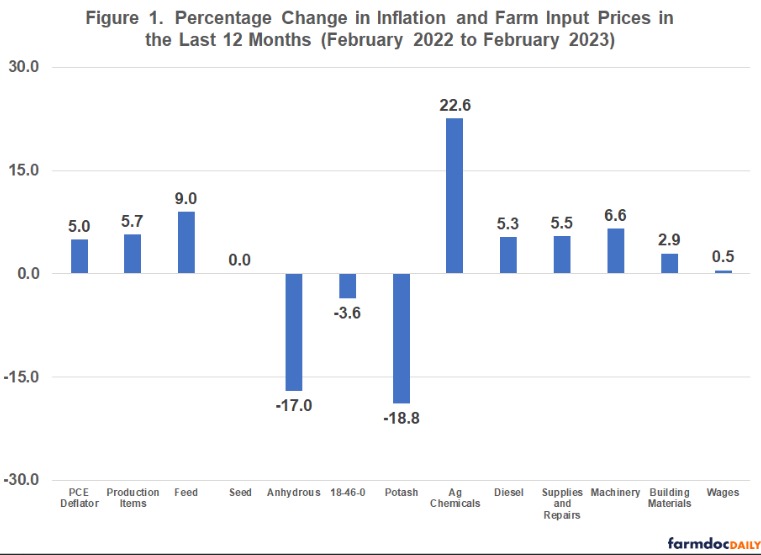
Figure 1 illustrates average input prices for the latest 12 months for which data were available (i.e., February 2022 to February 2023). The percentage change in the implicit price deflator was 5.0 percent. This is down slightly from the annual average in 2022 (i.e., 6.2 percent), but is still substantially above historical averages. The input price changes for seed, fertilizer, building materials, and wages were below the annual price change for the implicit price deflator. However, it is important to note that fertilizer prices are still well above what they were a couple of years ago. For example, the March 2023 price for anhydrous ammonia is still over 40 percent higher than it was in 2021. The input price for agricultural chemicals exhibited the largest increase during the last 12 months. The results in Figure 1 can be used to help explain why the breakeven prices for corn and soybeans are expected to increase again in 2023 after increasing approximately 26 and 15 percent, respectively, from 2021 to 2022.
Concluding Comments
This article discussed trends in general inflation and farm input prices. Over long periods of time, farm input prices are significantly correlated with general inflation. However, farm input prices are by no means perfectly correlated with general inflation. Each input has its own supply and demand fundamentals. Farm input price indices for machinery and labor were more correlated with general inflation than feed, seed, fertilizer, and fuels.
Of the input prices examined, the prices for seed, fertilizer, building materials, and wages were below the inflation rate for the implicit price deflator for personal consumption expenditures during the last 12 months. Despite some moderation in fertilizer prices, the breakeven prices for corn and soybeans are expected to be higher in 2023 than they were last year.
Source : illinois.edu