Similar to our previous work (farmdoc daily, April 14, 2021; April 21, 2021), this analysis focuses on USDA planted acreage revisions between the March Prospective Plantings and the January Crop Production Annual Summary reports. The January estimate is usually considered the “final” for a crop year. Hence, the change in estimates between March and January is the most relevant measure of the total revision for a crop year to the market.
In any given year, not all acres that are intended to be planted to crops ends up actually being planted due to weather delays and natural disasters such as flooding. Prevented plant coverage under the Federal crop insurance program provides payments when farmers are unable to plant within a normal time window (e.g., farmdoc daily, May 14, 2019). The FSA requires that producers participating in several Federal commodity programs submit an annual report regarding all cropland use on their farms, including prevented plant acreage (farmdoc daily, January 27, 2016). The FSA issues monthly reports of planted acreage to the public beginning in August based on farmer reports received and summarized to date. The final report is released in January and the data should represent a complete census of acreage enrolled in the farm programs administered by the FSA, including prevented plant acreage.
Figure 1 presents the final FSA data on prevented plant acreage for corn, soybeans, and all crops over 2007 through 2020. The all crops category consists of barley, corn, cotton, oats, rice, sorghum, soybeans, sugar beets, sugarcane, and wheat. We begin the series in 2007 because this is the first year that the FSA data on prevented plant acreage is available on the FSA website. It should be noted that the FSA prevented plant acreage shown in Figure 1 may be a slight undercount of actual prevented plant acreage because not all farms enroll in Federal commodity programs. For example, about 2-3 percent of corn and soybean planted acreage is not enrolled. Despite this limitation, we use the FSA prevented plant acreage because: i) any downward bias in FSA prevented plant acreage estimates should be very small; and ii) the FSA data is widely-used by market participants. The official data on prevented plant acreage from the Risk Management Agency (RMA) of the USDA is much less accessible.
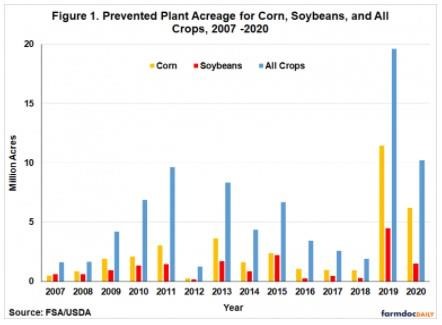
Figure 1 shows that there is technically an uptrend over 2007-2020 in prevented plant acres for corn, soybeans, and all crops, but this is highly influenced by the very high levels of prevented plant acres in 2019 and 2020. Due to extremely wet spring weather, corn, soybean, and all crop prevented plant acreage in 2019 reached record highs of 11.4, 4.5, and 19.6 million acres, respectively. Given the low levels of prevented planting acreage in 2017 and 2018 that preceded the 2019 and 2020 highs, it is likely that the patterns shown in Figure 1 are due to weather rather than secular uptrends in prevented plant acreage.
With this background, we can consider the relationship between USDA planted acreage estimates and prevented plant acreage. We start with the assumption that survey respondents for the March USDA Prospective Plantings report provide a complete accounting of all acreage they intend to plant. In other words, we assume that survey respondents in March expect zero acres of prevented plant. Assuming no change in planting intentions after March, this means that USDA March planting intentions represent the sum of what actually will be planted and what will be prevented plant. It then follows that the revision of USDA planted acreage estimates between March and January will exactly equal the magnitude of prevented plant acreage. An interesting implication is that so long as prevented plant acreage is positive, then the USDA March planting intention estimate should not be an unbiased estimate of the January final planted acreage estimate. These two should differ on average by the amount of prevented plant acreage. From this perspective, our earlier finding (farmdoc daily, April 14, 2021) that, on average, USDA March planted acreage estimates for corn, soybeans, and principal crops equal January estimates is puzzling.
The simple model outlined above can be stated algebraically as,
January planted acreage = March planted acreage – Prevented plant acreage,
or,
January planted acreage – March planted acreage = Prevented plant acreage.
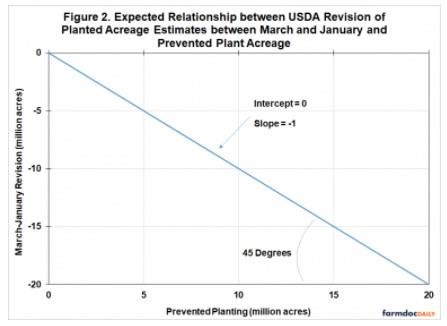
If this model strictly holds, data for USDA acreage revisions and prevented plant acreage will plot on a 45 degree line, as shown in Figure 2. The line has a slope of -1 because prevented plant acreage reduces planted acreage one-for-one. The intercept is zero because prevented plant acreage of zero is associated with no change in the USDA planted acreage estimates. In reality, we do not expect actual data on USDA acreage revisions and prevented plant to fall exactly on the 45 degree line. Instead, we expect to see the data scatter more or less evenly along the 45 degree line with the estimated intercept and slope not too different from zero and one.
Our first test of the model of USDA planted acreage revisions and prevented plant acreage is for corn in Figure 3. The scatter of data has the expected downward slope, with larger prevented plant acreage tending to be associated with negative March-January USDA planted acreage revisions. However, the estimated regression line (solid blue) sits above and to the right of the 45 degree line (dashed blue). What this means is that March-January revisions are smaller on average than the level of prevented plant acreage. As an example, if prevented plant is 4 million acres, the predicted March-January revision on the 45 degree line is -4 million acres. But the predicted level of the March-January revision on the regression line is only -1.2 million acres, or a difference of 2.8 million acres. It’s as if respondents to the March Prospective Plantings report expected there would be 2.8 million acres of prevented plant acreage but did not account for it in their survey responses. This is also exactly what happened in 2019, when prevented plant acreage for corn was 11.4 million acres and the March-January revision was only – 3 million acres.
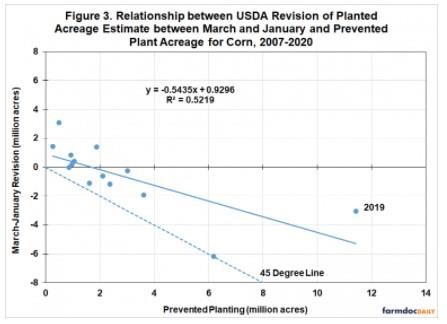
We also formally tested the hypothesis that the intercept and slope of the estimated regression equaled zero and one, respectively. Based on the graph, it is not surprising that this joint hypothesis was soundly rejected statistically. Finally, it is important to point out that the overall fit of the regression line to the data is only moderately high at 52.2 percent. This indicates there are other factors than prevented plant acreage that likely play an important role in explaining March-January USDA acreage revisions for corn.
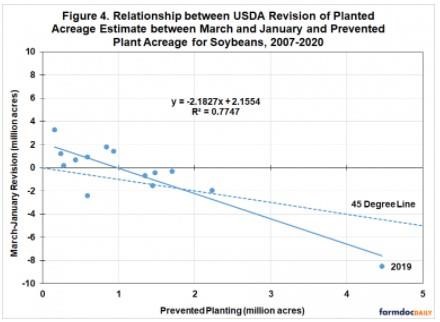
The second test of the model is for soybeans and it is found in Figure 4. The fit of the estimated regression line is much higher at 77.5 percent. Once again, there is a general tendency for larger prevented plant acreage tending to be associated with negative March-January USDA planted acreage revisions. However, there is a tendency for large prevented plant acreage to be associated with even larger March-January acreage revisions, and vice versa. So there is an offsetting bias in the relationship for soybeans.
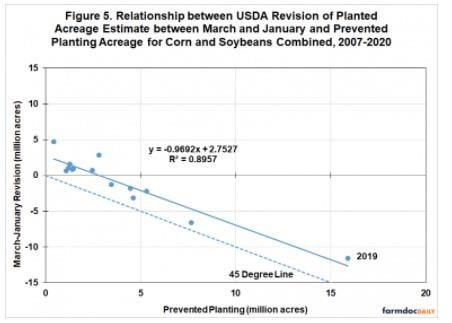
The third test of the model is found in Figure 5 for combined corn and soybean acreage. This test is stronger than the earlier tests for corn and soybeans separately because there can be strategic use of prevented plant provisions across the two crops, as happened in 2019. These strategic behaviors should roughly cancel out when acreage for the two crops is combined. To begin, the fit of the estimated regression line is quite high at 89.6 percent, which is evident in the tight scatter of the observations around the line. It is interesting to observe that in this case the estimated slope is insignificantly different from -1 but the estimated intercept is significantly different from zero. This means there is a constant bias of about 2.7 million acres between the level of prevented planting and the March-January acreage revision. As an example, if prevented plant for corn and soybeans totals 5 million acres, the predicted March-January revision on the 45 degree line is -5 million acres. But the predicted level of the March-January revision on the regression line is only -2.1 million acres, or a difference of 2.9 million acres. Following our earlier logic, it’s as if respondents for the March Prospective Plantings report expected there would be 2.9 million acres of corn and soybean prevented plant acreage but did not account for it in their survey responses. A good example of this tendency is 2019, when prevented plant acreage for corn and soybeans combined was 15.9 million acres and the March-January revision was only – 11.6 million acres.
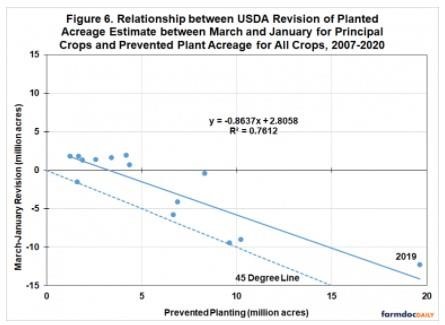
The fourth and final test of the model is shown in Figure 6 for all principal crop acreage. Before discussing these results, it is important to note that the different definitions are used for principal crops planted acreage and all crops prevent plant. Only 10 major crops are included in the all crops category for prevent plant, while over 20 major crops are included in the principal crops planted acreage. This could introduce additional noise into the estimated relationship. Recognizing the difference in data definitions, the estimated regression line fits reasonably well with an R2 of 76.1 percent. Once again, the estimated slope is insignificantly different from -1 but the estimated intercept is significantly different from zero. This means there is a constant bias of about 2.8 million acres between the level of prevented planting and the March-January acreage revision for principal crops. The observation for 2019 demonstrates this bias nicely, when prevented plant acreage for all crops was 19.6 million acres and the March-January revision for all principal crops was only – 12.3 million acres.
As a robustness check, we conducted all of the previous tests using the March-Final acreage revisions instead of the March-January revisions. The final USDA revisions incorporate changes in the year after the crop is harvested and as part of the every five year Agricultural Census. These final acreage estimates were downloaded from the USDA Quickstats database. The use of final acreage estimates did not materially change any of the results presented earlier.
Implications
In theory, intended planted acreage estimates from the USDA should fully incorporate both acreage that actually does get planted and prevented plant acreage that does not get planted due to weather problems. In this article, we develop and test a simple model of the relationship between revisions to USDA planted acreage estimates and prevented plant acreage. The model predicts that revisions to USDA planted acreage estimates from March to January will be equal but of opposite sign to that of prevented plant acreage. These predictions are generally rejected based on data for USDA March-January planted acreage revisions for corn, soybeans, and all principal crops over 2007-2020. While the estimated relationships have the expected downward slope, there is also a puzzling and statistically significant bias. As an example, if prevented plant for corn and soybeans totals 5 million acres, the predicted March-January revision should be -5 million acres. But the predicted level of the March-January revision is actually only -2.1 million acres, or a difference of 2.9 million acres. It’s as if respondents for the March Prospective Plantings report expected there would be 2.9 million acres of corn and soybean prevented plant acreage but did not account for it in their survey responses.
A practical implication of the results is that USDA March Prospective Plantings estimates of planted acreage for corn, combined corn and soybeans, and all principal crops are actually downward biased when there is more than a trivial amount of prevented plant crop acreage. This could lead market analysts to systematically underestimate planted acreage during critical parts of the growing season, as happened in 2019. The degree of potential bias is also non-trivial, representing almost three million acres for combined corn and soybean planted acreage.
There are a couple of caveats with regard to the results presented in this article. First, the statistical relationships are based on only 14 annual observations. This is a relatively small sample and the results could be heavily influenced by observations from a few years with dramatically large prevented plant acreage, such as 2019. Second, the data on USDA acreage estimates and prevented plant acreage are drawn from related but different sources. This may lead to seeming inconsistencies that are in fact simply due to different procedures when collecting the different data sets. Regardless, further research is needed to confirm the results in this article, and if confirmed, determine what is driving the bias in March USDA planted acreage estimates.
Source : illinois.edu