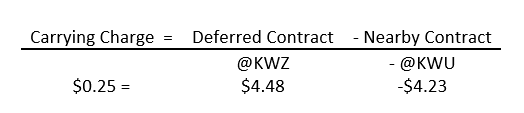
Next, the farmer needs to calculate the carrying charge.
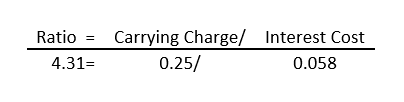
Finally, the interest cost-to-carry ratio is calculated by dividing the carrying charge by the interest cost.
Date
| | Sidney
Cash Price | @KWU
(Sep) | Interest
Rate1 | @KWZ
(Dec) | Ratio | @KWH
(Mar) | Ratio | @KWK
(May) | Ratio | @KWN
(July) | Ratio |
|---|
| 7/20/2006 | 4.66 | 5.03 | 9.25% | 5.18 | 0.84 | 5.20 | 0.62 | 5.01 | -0.04 | 4.90 | -0.29 |
|---|
| 7/19/2007 | 5.38 | 6.07 | 9.25% | 6.22 | 0.71 | 6.31 | 0.73 | 6.15 | 0.20 | 5.61 | -0.92 |
|---|
| 7/17/2008 | 7.46 | 8.39 | 6.00% | 8.61 | 1.19 | 8.83 | 1.49 | 8.96 | 1.54 | 8.94 | 1.24 |
|---|
| 7/16/2009 | 4.55 | 5.60 | 4.25% | 5.76 | 2.05 | 5.93 | 2.56 | 6.04 | 2.73 | 6.15 | 2.84 |
|---|
| 7/22/2010 | 4.41 | 6.12 | 4.25% | 6.29 | 2.24 | 6.45 | 2.66 | 6.53 | 2.63 | 6.60 | 2.59 |
|---|
| 7/21/2011 | 6.79 | 7.74 | 4.25% | 7.98 | 2.00 | 8.11 | 1.90 | 8.16 | 1.73 | 8.19 | 1.54 |
|---|
| 7/19/2012 | 8.52 | 9.38 | 4.25% | 9.51 | 0.86 | 9.47 | 0.35 | 9.39 | 0.03 | 8.70 | -1.88 |
|---|
| 7/18/2013 | 7.12 | 7.02 | 4.25% | 7.16 | 1.09 | 7.26 | 1.19 | 7.31 | 1.15 | 7.27 | 0.81 |
|---|
| 7/17/2014 | 5.92 | 6.49 | 4.25% | 6.60 | 1.05 | 6.67 | 1.09 | 6.72 | 1.09 | 6.59 | 0.40 |
|---|
| 7/16/2015 | 4.96 | 5.53 | 4.25% | 5.73 | 2.25 | 5.87 | 2.39 | 5.95 | 2.38 | 6.01 | 2.26 |
|---|
| Average | 5.98 | 6.74 | -- | 6.90 | 1.43 | 7.01 | 1.50 | 7.02 | 1.34 | 6.90 | 0.86 |
|---|
| 1 Interest rates vary by operation. This value is the national prime rate plus 1 percentage point. |
If this ratio is greater than 1.40, the carrying charge is large enough for the farmer to gain from using an HTA or cash forward contract. The larger the value, the higher the returns from storage. In this example, the ratio is large enough for the farmer to benefit from a cash forward or HTA contract.
Some may be wondering, why is interest expense a concern when selling grain? If a farmer sells their grain earlier in the year, they can use the cash to pay down on their operating note, or other expenses. If a farmer holds grain unpriced, they are paying interest on a larger amount of debt. The local price, interest rate, and storage expense vary by operation. The above calculation allows a farmer to estimate quickly if “selling the carry” is profitable for the operation.
Table 1 shows the Sidney cash price, the interest rate, and the contract prices for the four deferred contracts on the first Thursday after July 15 since 2006. The yellow shaded values indicate a ratio higher than 1.40; the green shaded boxes indicate the most profitable deferred contract.
As illustrated by Table 1, for five out of ten years it has been profitable for farmers in Sidney to sell the carry. It is likely that similar results can be found across Nebraska, depending on the basis and the farmer’s interest rate. Large carrying charges are usually associated with large carryover stocks and high yields like we are experiencing now.
Looking at June 2016 ratios of carrying charge to interest, it is clear that there are prominent signals for winter wheat producers to price grain now for delivery in a future month. Table 2 outlines these ratios, the yellow shaded boxes indicate the highest returns from storage. If these spreads hold into harvest it may be advantageous for producers to use a cash forward contract or HTA rather than a cash bid to market their winter wheat.
Date
| | Sidney
Cash Price | @KWU
(Sept) | Interest
Rate1 | @KWZ
(Dec) | Ratio | @KWH
(Mar) | Ratio | @KWK
(May) | Ratio |
|---|
| 1-Jun | 3.75 | 4.72 | 4.5% | 4.96 | 3.31 | 5.12 | 3.52 | 5.22 | 3.52 |
|---|
| 2-Jun | 3.89 | 4.81 | 4.5% | 5.05 | 3.29 | 5.21 | 3.47 | 5.31 | 3.46 |
|---|
| 3-Jun | 3.93 | 4.90 | 4.5% | 5.13 | 3.16 | 5.29 | 3.35 | 5.39 | 3.36 |
|---|
| 6-Jun | 3.96 | 4.98 | 4.5% | 5.22 | 3.16 | 5.38 | 3.37 | 5.48 | 3.37 |
|---|
| 7-Jun | 3.95 | 5.01 | 4.5% | 5.25 | 3.27 | 5.42 | 3.46 | 5.52 | 3.43 |
|---|
| 8-Jun | 4.01 | 5.09 | 4.5% | 5.34 | 3.23 | 5.50 | 3.37 | 5.60 | 3.35 |
|---|
| 9-Jun | 3.92 | 5.01 | 4.5% | 5.26 | 3.37 | 5.42 | 3.47 | 5.51 | 3.42 |
|---|
| 10-Jun | 3.77 | 4.86 | 4.5% | 5.10 | 3.47 | 5.26 | 3.56 | 5.36 | 3.58 |
|---|
| 13-Jun | 3.69 | 4.78 | 4.5% | 5.03 | 3.58 | 5.19 | 3.66 | 5.29 | 3.69 |
|---|
| 14-Jun | 3.67 | 4.77 | 4.5% | 5.01 | 3.60 | 5.17 | 3.71 | 5.28 | 3.73 |
|---|
| 15-Jun | 3.65 | 4.75 | 4.5% | 5.00 | 3.66 | 5.16 | 3.75 | 5.26 | 3.75 |
|---|
| 16-Jun | 3.59 | 4.69 | 4.5% | 4.94 | 3.76 | 5.10 | 3.86 | 5.21 | 3.87 |
|---|
| 17-Jun | 3.69 | 4.79 | 4.5% | 5.03 | 3.51 | 5.19 | 3.62 | 5.29 | 3.65 |
|---|
| 20-Jun | 3.59 | 4.69 | 4.5% | 4.94 | 3.76 | 5.11 | 3.88 | 5.22 | 3.91 |
|---|
| 21-Jun | 3.43 | 4.53 | 4.5% | 4.78 | 3.97 | 4.95 | 4.09 | 5.05 | 4.11 |
|---|
| 22-Jun | 3.41 | 4.51 | 4.5% | 4.77 | 3.99 | 4.93 | 4.11 | 5.04 | 4.13 |
|---|
| 23-Jun | 3.36 | 4.46 | 4.5% | 4.71 | 4.01 | 4.88 | 4.17 | 4.98 | 4.15 |
|---|
| 24-Jun | 3.31 | 4.41 | 4.5% | 4.67 | 4.16 | 4.83 | 4.26 | 4.94 | 4.26 |
|---|
| 27-Jun | 3.18 | 4.31 | 4.5% | 4.57 | 4.32 | 4.74 | 4.43 | 4.84 | 4.42 |
|---|
| 28-Jun | 3.15 | 4.28 | 4.5% | 4.54 | 4.37 | 4.71 | 4.48 | 4.81 | 4.47 |
|---|
| 29-Jun | 3.06 | 4.20 | 4.5% | 4.46 | 4.49 | 4.62 | 4.60 | 4.73 | 4.64 |
|---|
| 30-Jun | 3.10 | 4.23 | 4.5% | 4.48 | 4.35 | 4.64 | 4.50 | 4.75 | 4.52 |
|---|
| 1Interest rates vary by operation. |
With 2016’s wheat harvest moving north, prices continue to decline but the carrying charge has remained. Taking advantage of the carry may help increase your income. Local elevators may not offer HTA contracts. Consult with your local grain merchandiser about what types of contracts are available and the terms of those contracts.
Source:unl.edu