As the U.S. and global economies began recovering from the Coronavirus (COVID-19) pandemic, demand for many commodities started to return to pre-pandemic levels. At the same time, supply-chain disruptions increased costs of inputs, such as fertilizer, pesticides, feed, and seed, and introduced additional uncertainty into the markets. The prices of the four largest U.S. field crops by area—corn, soybeans, wheat, and upland cotton—are expected to be inflated in 2021/22 for differing reasons:
- U.S. wheat production in the 2021/22 marketing year was reduced by drought in the Northern Plains while Canada also experienced weather-related drops in production that placed upward pressure on prices.
- Cotton prices have historically increased with global economic growth. As the economy entered recovery, global import demand rebounded. Meanwhile, U.S. cotton supplies for the 2021/22 marketing year were projected at a 6-year low, prompting cotton markets to respond with projected record-high season average nominal price levels.
- Corn prices leading into the start of the projection period are also at the highest levels in nearly a decade. Export demand for corn has approached historical highs as imports by China more than tripled from the previous year’s levels in 2020/21 and remain elevated in 2021/22. Reduced production in Brazil and Ukraine in 2020/21, caused by weather-related stress, has further supported rising corn prices.
- Soybean prices for the 2021/22 marketing year are also at recent peaks. U.S. sales to China have recovered following implementation of the U.S.-China Phase One trade agreement. Increased demand for soybean oil destined for biofuel production along with comparatively low U.S. stocks at the beginning of the year have further bolstered soybean prices.
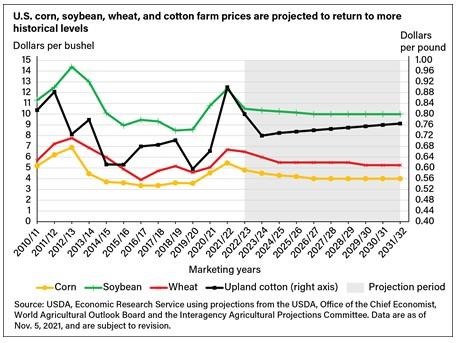
Moving into the 2022/23 Baseline marketing year projection, prices for these four crops are generally expected to move to levels more in line with historical patterns, as weather returns to average conditions and supply rebounds both in the United States and globally to meet increases in demand. Over the long term, prices are projected to revert to longer term, underlying trends.
Embed this chart
Download higher resolution chart (2048 pixels by 1517, 242 dpi)
The U.S. corn farm price is projected to gradually decline from a recent season average farm price peak of $5.45 per bushel in 2021/22 each year through the 2026/27 marketing year before leveling off at $4.00 per bushel the remainder of the projection. If realized, this would mark a 27-percent decrease in nominal corn prices from 2021/22 through the end of the 10-year Baseline projection period (starting in 2022/23) and a return to price levels that are more consistent with price levels before 2020/21.
U.S. soybean farm prices are projected to drop in the 2022/23 marketing year from the 2021/22 peak of $12.35 per bushel to a season average of $10.50 per bushel in 2022/23 before slowly declining and ultimately leveling off at $10.00 per bushel from 2026/27 through the end of the projection period.
The 2021/22 season average all-wheat farm price is estimated at $6.70 per bushel before declining in the first 3 years of the projection period to $5.50 per bushel. Prices are expected to fall another 25 cents per bushel in the final 3 years, ending at $5.25 per bushel in 2031/32, 22 percent lower than the price for 2021/22.
Season average farm prices for cotton were anticipated to be 90 cents per pound in 2021/22 based on the October 2021 WASDE and are projected to decline to 72 cents per pound by 2023/24, driven primarily by an increase in production. Cotton farm prices are expected to rise slowly each year through the remainder of the projection period, climbing to 76.5 cents per pound in 2031/32.
Production Expected To Increase, Particularly for Corn and Cotton
Embed this chart
Download higher resolution chart (2048 pixels by 1635, 242 dpi)
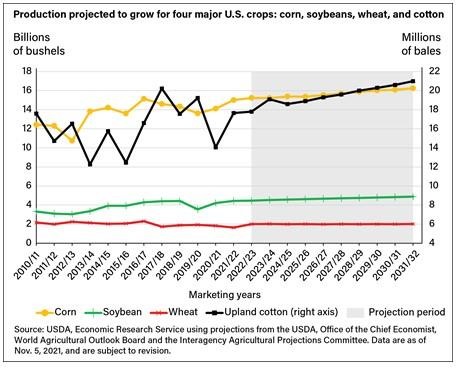
Corn production is projected to grow steadily from 15.0 billion bushels in the 2021/22 marketing year to 16.3 billion bushels in 2031/32, an increase of 8 percent. Corn planted acreage is expected to decline from 93.3 million acres in 2021/22 to 89.5 million acres in 2031/32, but continued adoption of new production practices and technologies is expected to support long-term trends in yield growth, which is the case for most field crop commodities. Corn yield is projected to increase from 176.5 bushels per acre in 2021/22 to 199 bushels per acre in 2031/32, consistent with historic trends.
Soybean production is projected to increase 10 percent from marketing year 2021/22 to 2031/32, increasing from 4.45 billion bushels to 4.88 billion bushels. Demand for soybeans is supported in part by increased demand for soybean oil used in biofuel (especially renewable diesel) production. Soybean planted acreage is projected to increase from 87.2 million acres in 2021/22 to 88.0 million acres in 2023/24 through the remainder of the projection period while yield is forecast to trend upward from 51.5 bushels per acre in 2021/22 to 56 bushels per acre in 2031/32, averaging a half-bushel yield increase per year.
Higher prices and a recovery from the severe drought that reduced production in the Northern Plains during the 2021 harvest are expected to support a production increase in 2022/23 for wheat before leveling off during the remainder of the projection period. Wheat production is projected to increase from 1.65 billion bushels in 2021/22 to 2.0 billion bushels in 2022/23 and to undergo only minor annual fluctuations through 2031/32. The increase in production from 2021/22 to 2022/23 is driven by year-over-year increases in both yield and acreage. Wheat yield is projected to increase from 44.3 to 49.1 bushels an acre from 2021/22 to 2022/23 and continue a gradual upward trend through 2031/32, ending the period at 52.6 bushels per acre. Planted acreage is also expected to increase from 46.7 million acres in 2021/22 to 49 million acres in 2022/23 before beginning a slow decline to 46 million acres in 2031/32. This slow decline in acreage would be offset by increases in yield, leaving production relatively constant.
Cotton production is projected to increase 19 percent from the October 2021 forecast of 17.7 million 480-pound bales in 2021/22 to 21.0 million bales in 2031/32. Planted area is expected to increase from 11.1 million acres in 2021/22 to 13.4 million acres by the end of the 10-year projection period while yield increases from 864.6 pounds reported in the October 2021 WASDE for 2021/22 to 910 pounds per acre in 2031/32.
Exports To Rise, but Exports Relative to Production Remain Stable
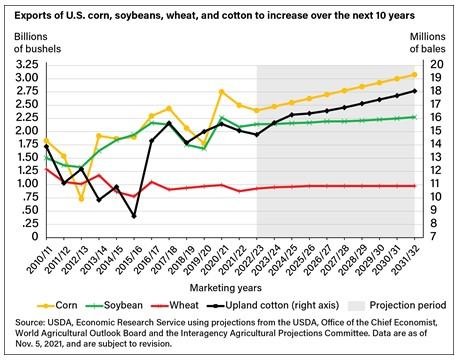
Exports are an important source of demand for each of the four major U.S. field crops, most prominently for cotton, followed by soybeans and wheat, and by a lesser but still significant level for corn. Despite a projected rebound from the weather-hampered 2021/22 crop, wheat exports are expected to remain generally flat, while exports for the other crops all rise, particularly for cotton and corn. While exports of these major crops are expected to increase, they are projected to increase in line with production.
Embed this chart
Download higher resolution chart (2048 pixels by 1597, 242 dpi)
Embed this chart
Download higher resolution chart (2048 pixels by 1620, 242 dpi)
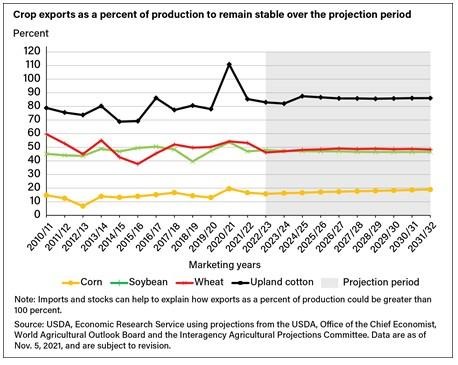
For corn, exports are expected to increase from 2.5 billion bushels in 2021/22 to a record 3.1 billion bushels in the 2031/32 marketing year. Exports are also increasing as a share of production, moving from 17 percent of production in 2021/22 to 19 percent of production during the 2031/32 marketing year. China is expected to continue to import more corn than it had been before its recent spike.
Soybean exports are also projected to grow steadily despite rising competition from South American supplies. U.S. exports are expected to increase from 2,090 million bushels in 2021/22 to 2,275 million bushels in 2031/32. Soybean exports as a share of production remains consistent throughout the projection period (decreasing less than half a percent by 2031/32).
Wheat exports are expected to increase over the projection period from 875 million bushels in 2021/22 to 975 million bushels in 2031/32, although 2021/22 exports are below the recent 5-year average because of reduced production in drought-stricken U.S. wheat-producing regions. Wheat exports as a share of production declines from 53 percent in 2021/22 to 46 percent in 2022/23 as production rebounds and then levels off between 48 and 49 percent for the remainder of the projection period.
Exports are the largest source of demand for U.S. cotton. Cotton exports are expected to mirror production, increasing from 15 million 480-pound bales in 2021/22 to 18 million bales in 2031/32, as the global economy is expected to rebound. Exports as a share of production are expected to increase slightly from 85 percent in 2021/22 to 86 percent in 2031/32.
Baseline Projections Reflect Underlying Trends
The USDA Baseline projections reflect underlying conditions, both domestically and globally, that drive changes in the supply, use, and prices of agricultural commodities. With no policy changes, an ongoing steady economic recovery, and normal weather conditions, the prices, production, and export trends for these four leading U.S. field crops are projected to revert to the trends observed over the last decade. Planted acreage is generally expected to be stable for corn and soybeans, decline for wheat (consistent with a multi-decade trend), and grow moderately for cotton as global trade demand rises. Yield and/or area growth are projected to support rising production and exports for corn, cotton, and soybeans, and stable production and exports for wheat.
The full USDA Baseline projections, released annually each February, cover these and other crops, including specialty crops such as fruits and vegetables, and animal/animal products such as beef, pork, chicken, turkey, eggs, and dairy. Although the projections for the domestic commodities do not change from the prior November release, additional information and materials are included, such as U.S. farm income projections, specialty crop projections, more detailed trade data for major commodity exporters and importers, and other indicators of the farm sector.
Source : usda.gov