Table 1. Milk volume, milk fat and milk protein percent required to achieve 7 pounds of components
| Milk production pounds/cow | Milk fat percent | Milk protein percent | Component pounds |
|---|
| 100 | 4.2 | 3.1 | 7.3 |
| 100 | 4.1 | 3.1 | 7.2 |
| 100 | 4.0 | 3.1 | 7.1 |
| 100 | 3.9 | 3.1 | 7.0 |
| 100 | 4.0 | 3.2 | 7.2 |
| 100 | 3.9 | 3.2 | 7.1 |
| 100 | 3.8 | 3.2 | 7.0 |
| 95 | 4.2 | 3.2 | 7.0 |
| 95 | 4.1 | 3.3 | 7.0 |
Action plan for reaching 7 pounds of components
Goal - Increase pounds of components by one half pound above average from 2019.
Step 1: Using the monthly milk checks from 2019, enter in Excel the average milk pounds per cow and the percent fat and protein for each month for the year.
Step 2: Using Excel, calculate the pounds of components monthly and the annual average. Set a goal for one half pound higher than what was achieved in 2019.
Step 3: Evaluate the months with the lowest milk production and components. Develop a plan to minimize reductions during those times of the year.
Step 4: Monitor pounds of components monthly and include this as a metric for discussion groups or profit team meetings.
Step 5: Work with the appropriate consultants to implement strategies to meet goals for pounds of components.
Economic perspective:
Monitoring must include an economic component to determine if a management strategy is working or not. For the lactating cows, income over feed cost is a good way to check that feed costs are in line for the level of milk production. Starting with July 2014’s milk price, income over feed cost was calculated using average intake and production for the last six years from the Penn State dairy herd. The ration contained 63% forage consisting of corn silage, haylage and hay. The concentrate portion included corn grain, candy meal, sugar, canola meal, roasted soybeans, Optigen and a mineral vitamin mix. All market prices were used.
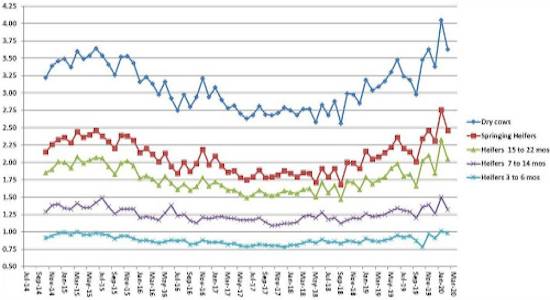
Also included are the feed costs for dry cows, springing heifers, pregnant heifers and growing heifers. The rations reflect what has been fed to these animal groups at the Penn State dairy herd. All market prices were used.
Income over feed cost using standardized rations and production data from the Penn State dairy herd.
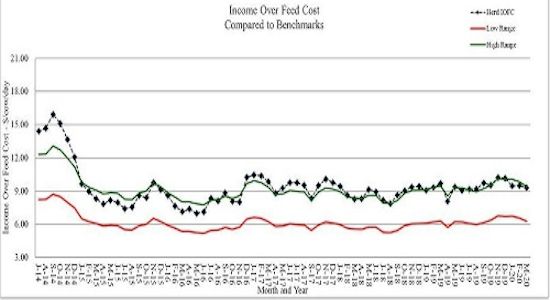
Note: March’s Penn State milk price: $18.65/cwt; feed cost/cow: $6.38; average milk production: 84 lbs.
Feed cost/non-lactating animal/day.
Source : psu.edu