RP will trigger payments when harvest revenue — harvest price times actual yield — is below the RP guarantee.
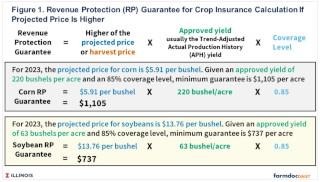
For 2023, the projected price for corn is $5.91 per bushel, set based on December 2023 CME futures prices in February. Given an approved yield of 220 bushels per acre and an 85% coverage level, the minimum guarantee is $1,105 per acre (5.91 x 220 x .85).
On July 5, 2023, the December 2023 CME futures contract settled at $4.94 per bushel, down by 16% from the $5.91 projected price. A harvest price of $4.94 would trigger crop insurance payments for an 85% RP policy, given that the actual yield is near or below the approved yield. To illustrate, take the above example with a $1,105 RP guarantee. Actual revenue would be $1,087 per acre at a $4.94 harvest price and a 220 actual yield, the same as the TA-APH yield. RP would pay $18 per acre ($1,105 – $1,087).
At an 85% coverage level, RP will trigger payments at $5.03 per acre when the actual yield is at or below the approved yield. Trigger prices decrease to $4.73 for the 80% coverage level, $4.43 for the 75%, and $4.14 for the 70% coverage level (see Figure 2). Any further price declines will result in higher crop insurance payments for those farmers who have purchased at an 85% coverage level. Even at an 80% coverage level, new crop sales have little risk management benefit, as the December contract is only $.21 above the $4.73 trigger level.
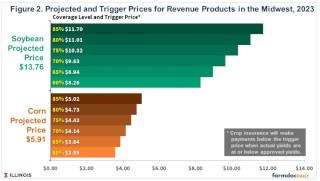
The soybean situation differs from corn. The settlement price for soybeans on July 5 was $13.55 per bushel, only $.21 below the 2023 projected price of $13.76. The trigger price for soybeans at an 85% RP coverage level is $11.70, considerably lower than current future prices. There is more downside to protect on soybeans than corn. From a risk management standpoint, focusing on soybean sales can protect downside revenue risk more than corn sales.
Recent Weather and Drought
The trigger prices in Table 1 are calculated assuming that the actual yield equals the approved yield. Given recent dry conditions, lower than approved yields are possible, causing crop insurance to pay at higher prices than trigger prices shown in Figure 2.
Much of the Corn Belt has received significant rain in the past several weeks. Many areas have received over 1.5 inches of rain, with some receiving over 3 inches. This rain raised expected yields if that rain was not accompanied by wind, hail, or other adverse weather.
Even with these rains, many areas likely still will be classified as in drought. The June 29 drought monitor map shows that 100% of Illinois and 98% of Iowa as dry or drought conditions. Much of these two states continue to have low soil moisture levels even after the rains, leading to a more-heightened need for continuing rains during July.
The June 29 Drought Monitor does not point to above-average state yields. Without knowing weather conditions, trends suggest a 2023 state yield of 203 bushels per acre for Illinois. Reaching this 203-bushel level requires widespread rains across Illinois. Rains during July can be spotty, leaving some areas low on moisture resulting in lower yields. Similar concerns exist for Iowa, Indiana, and other Midwest states. Recent rains likely eliminated the chance of widespread drought, like in 1988 and 2012, but state yields below the trend are still possible.
July weather will significantly impact corn yields. Soybeans do not have a critical pollination period like corn. As a result, soybean yields are not as impacted by July weather, and soybean yields have a much higher chance of being at or above trend when compared to corn.
Price Trends
The December 2023 corn contracts have been highly volatile for several months. From a $5.92 average in February, corn prices fell to $5.00 by mid-May. Much of this decline was associated with good production in Brazil and excellent planting progress in the U.S. Overall, trend yields or above were expected to result in lower corn prices.
Prices then began increasing, reaching $5.49 by June 13. Then, corn prices increased dramatically over the next week, reaching $6.20 per bushel by June 21. On June 21, price patterns in 2023 looked much like those in 2012 (see Figure 3), the last major drought year across the Midwest. The 2023 increase can be attributed to extremely dry weather, leading to drought concerns and the potential for much lower yields.

Rains fell over some of Iowa during the third week of June and over Illinois during the last week of June. Prices then fell dramatically, reaching $5.28 on Thursday, June 29. Prices fell another $.32 on Friday June 30, likely due to USDA’s release of the Acreage Report indicating more acres of corn than expected (farmdoc daily, July 4, 2023). Settlement prices were $4.95 on June 30, and $4.94 on July 3 and July 5. Those levels are about the same as in mid-May.
July 5 prices likely reflect that concerns of a large-scale drought have been reduced, and expected corn yields may be near trend yield. However, given this year’s growing conditions, trend yields are not a foregone conclusion, and weather over the next several weeks will have yield impacts. The first estimate on crop yields from the U.S. Department of Agriculture will be in August. Those estimates could have large price impacts, as will have crop prospects in other northern hemisphere countries.
Income Prospects
Overall, recent rainy weather lowered farm income prospects in the Midwest because of the associated decrease in corn prices. Incomes were high in the 2012 drought due to higher prices and crop insurance payments (see Figure 1 in farmdoc daily, November 15, 2022). Prospects of drought-induced price increases are no longer evident.
Average incomes across Illinois grain farms enrolled in FBFM are projected at $81,000 per farm, near levels from 2014 to 2019, a relatively low-income time. While 2023 prices are higher than from 2014 to 2019, costs also are much higher, leading to lower income projections (farmdoc daily, May 23, 2023). The 2023 income prospects are significantly below record incomes in 2021 and 2022 (farmdoc daily, November 15, 2022).
Much obviously depends on the weather. As the saying goes, July will be an interesting month.
Source : illinois.edu