Cover-Crop Acres Up in Texas, Stagnant Across Rest of the South

May 17, 2024

By Alejandro Plastina & Wendiam Sawadgo

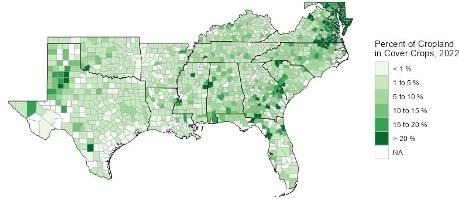
The USDA recently released data from the 2022 census of agriculture. In 2022, cover crops were planted on 6.2% of the total cropland acres in the South, surpassing the national average of 4.7% for the 48 contiguous states. In fact, the top five counties in the US in terms of percent of cropland in cover crops were all from the South, located in Virginia, Maryland, and Florida. However, there is substantial variation in the adoption of cover crops across counties, as shown in Figure 1. Maryland led the way with 27.3% of its total cropland acres in cover crops, followed by Virginia at 15.2%. On the other end of the spectrum, Louisiana and Arkansas had the lowest rates, at 3.2% and 3.4%, respectively. 

Figure 1: 2022 Southern Cover Crop Adoption Rate by County, as Percent of 2022 Cropland

crops

Data source: 2022 U.S. Census of Agriculture 

Between 2017 and 2022, there has been a significant change in cover-crop adoption across the southern states. Texas saw the largest increase in cover-crop area in the US, adding over half a million acres, corresponding to a 1.9 percentage-point increase as a percentage of 2022 cropland. The remaining states in the South combined for a net increase of just fifty-thousand cover crop acres. This was largely due to the disadoption of the practice, as six states observed decreases in cover-crop acreage from 2017-2022. In fact, 49.8% of counties in the southern states saw disadoption over the period – as demonstrated by the blue counties in Figure 2 – disadopting over one million acres of cover crops in total. Overall, the adoption of cover crops decelerated between 2012-2017 and 2017-2022, driven by the increased number of counties that experienced disadoption.

Click here to see more...
Subscribe to our Newsletters

Trending Video