Discussion
Figures 1a through 1c illustrate the CBO projections for corn. Figure 1a graphs the total base acres for corn (bars) and CBO’s projections for program participation based on the percent of those acres enrolled in PLC (red) or ARC-CO (blue). CBO is projecting that a majority of the nearly 93.7 million corn base acres will be enrolled in PLC throughout the ten-year baseline. Figure 1b graphs the MYA projections for corn against the effective reference price, which increases above the MYA for FY2025 through FY2027 triggering expected PLC payments associated with those years. Figure 1c graphs the projected spending by PLC and ARC-CO for corn. For spending, it is important to remember that payments are made in October after the 12-month MYA is calculated; this pushes payments into the subsequent fiscal year, which begins October 1. Thus, payments for deficiencies on the 2025 crop are paid in October of 2026, which is fiscal year 2027.
 Figures 2a through 2c provide similar information for soybeans. Figure 2a graphs the enrollment assumptions with the majority of the 52.5 million base acres of soybeans enrolled in ARC-CO. According to CBO projections, the MYA for soybeans remains above the effective reference (adjusted by the escalator provision) in all years, but substantially above it in the outyears (after FY2029). Both participation and projected prices impact estimate spending on soybeans from the programs, as illustrated in Figure 2c.

Figures 3a through 3c provide the CBO projections for wheat. As illustrated in figure 3a, almost all of the 63.7 million base acres of wheat are projected to be enrolled in PLC. The CBO price projections in Figure 3b provide much of the explanation. CBO projects MYA prices below the effective reference prices in most years, driving expectations for PLC payments on wheat base as illustrated in Figure 3c. The expectations of payments from PLC drives the assumption that farmers with wheat base will enroll in that program.
 The 2018 Farm Bill returned cotton to Title I after it was removed in the 2014 Farm Bill in response to the World Trade Organization dispute initiated (and won) by Brazil. For cotton, the program crop is now referred to as seed cotton and its program calculations involve a combination of cotton lint and cottonseed prices and yields. Figures 4a through 4c repeat the illustrations for the CBO projections for seed cotton. With just under 13 million base acres of seed cotton, CBO projects 70% or more to be enrolled in PLC (Figure 4a). CBO projects MYA prices for seed cotton to fall noticeably and declining below the effective reference price in the outyears (after FY2028), as illustrated in Figure 4b. This impacts projected outlays in PLC as illustrated in Figure 4c, and drives the assumption for enrolling seed cotton base in PLC.

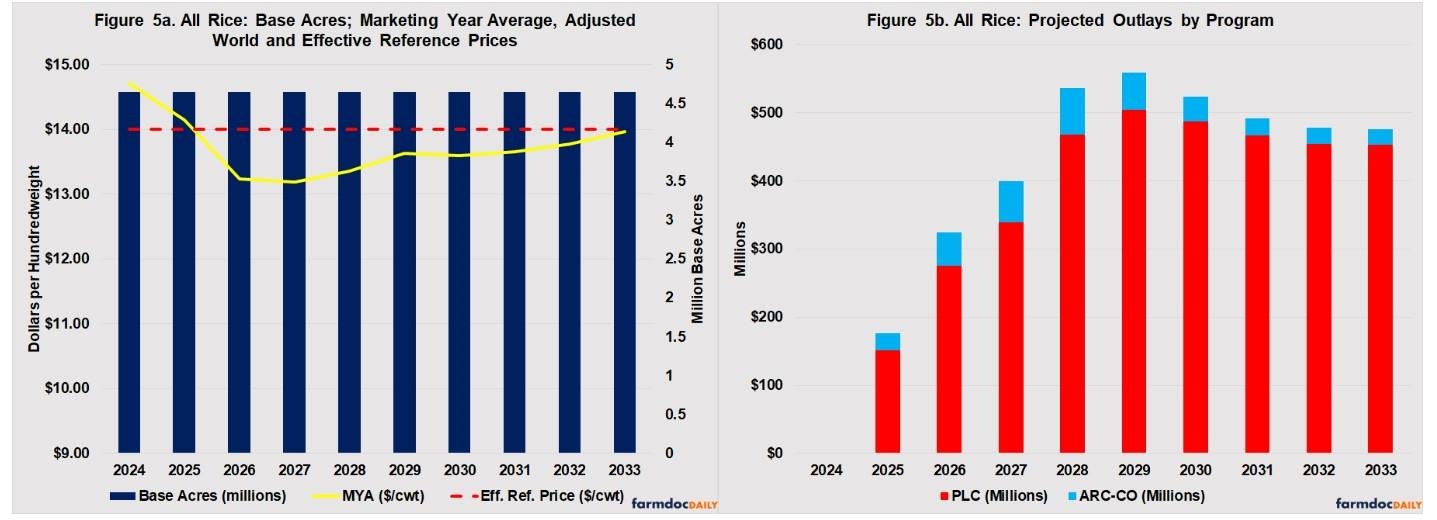
CBO does not provide participation assumptions for rice base acres, likely because almost all of the 4.6 million acres of rice base would be assumed to enroll in PLC. Figure 5a graphs total base acres and the projected MYA prices for all rice. Projections for all rice are somewhat misleading because the programs cover medium and short grain rice, long grain rice, and temporate japonica rice. Long and short/medium grain rice have the same statutory reference price ($14.00/cwt) but have different MYA prices; temporate japonica rice has a higher statutory reference price ($17.30/cwt) and a different MYA price calculation. The actual prices used to calculate PLC payments for each type of rice tend to be lower than the projected MYA (see, FSA, ARC/PLC Program Data). That actual MYA prices are lower than projections can be seen in the consistently higher payments for all rice base each year, as illustrated in Figure 5b.
Finally, Figures 6a and 6b graph the projections for peanuts. CBO does not provide program participation or enrollment assumptions and Figure 6a illustrates total base acres for peanuts (2.5 million), as well as the MYA prices and the effective reference price. CBO projects MYA for peanuts to be consistently below the effective reference price, which is the statutory reference price ($0.2675 per pound). This would be expected to trigger payments each year, and large payments per base acre. Figure 6b illustrates CBO’s projections for peanut payments.
 Finally, Figure 7 calculates the total projected program spending for ARC-CO and PLC in the CBO February 2023 Baseline, divided by 85% of the total number of base acres for each of the major program crops for each fiscal year. Actual payments for PLC and ARC-CO are made on only 85% of the crop’s base acres. The amounts in Figure 7 are not actual payments, nor projected payments; the amounts are simply the total projected outlays by crop each fiscal year divided by the payment acres.
The disparities amongst the projected spending for these crops is striking. The maximum for soybeans is just under $25 per payment acre, while the maximum for peanuts exceeds $150 per payment acre in three fiscal years and $149 per payment acre in four. The differences in spending per payment is a direct result of the decisions by Congress in setting the statutory reference prices. The higher Congress sets the statutory reference price relative to actual or projected market prices, the more likely PLC will trigger payments and the larger the payments. It is also notable that the crops with the smallest base acreage in the program have the highest reference prices relative to the projected MYA prices.
Conclusion
The CBO baseline projections highlight rather glaring disparities amongst farmers with base acres in the different program crops. The projections also expose the degree to which budget discipline rules impact policy design and facilitate disparities in program operation. It is far more expensive for Congress to set reference prices for the large acreage crops like corn, wheat and soybeans when that decision is scored over 10 years and tens of millions of base acres. For example, to pay $100 on 85% of corn’s 93.7 million base acres could cost nearly $80 billion in a ten-year projection, but paying $100 on 85% of peanuts’ 2.5 million base acres would cost just over $2 billion in a ten-year projection, or just under $4 billion for rice’s 4.6 million base acres. To put it simply, budget policy that focuses on bottom line projections over ten-year budget windows favors smaller interests in the political competition. Large payments to a smaller subset of farmers with the fewest acres in the program cost much less than even small payments to a larger subset of farmers with the most acres in the program—corn payments in the $5 range would cost about as much as $100 for rice base and nearly twice as much as $100 for peanut base. This scoring dynamic will likely impact any discussions to increase statutory reference prices and have an outsized influence on the policy debate.
Source : illinois.edu