By R.L. (Bob) Nielsen
Agronomy Dept., Purdue Univ.
Delayed planting seasons create a lot of frustrations for everyone involved with planting crops. One of the agronomic questions that comes up when planting is seriously delayed is whether farmers should consider switching from their normal full-season maturity hybrids to shorter-maturity hybrids. The question is based, of course, on the perceived risk of the crop not reaching physiological maturity before a killing fall freeze and the yield losses that could result. A related, and economic, concern with delayed planting of normal full-maturity hybrids is the risk of high grain moisture contents at harvest and the resulting costs incurred by artificial drying of the grain or price discounts by buyers.
Corn development (think growth stage progress) is very dependent on temperature (warm = fast, cool = slow). The accumulation of heat on a daily basis can be quantified on the basis of calculated Growing Degree Days or GDDs. Hybrids can be characterized by how many GDDs they require from planting to physiological maturity (kernel black layer). Conceptually, therefore, one should be able to estimate the GDDs remaining from a delayed planting date to the end of the season using long-term climate data and then choose hybrids with GDD ratings that should mature no later than the date you chose to define "the end of the season".
FYI: The GDD concept and calculation are described in a related article (Nielsen, 2012a). Interpretation of corn hybrid maturity ratings is also discussed in a related article (Nielsen, 2012b).
One "wrinkle" in this concept is that it appears that hybrids mature in fewer GDDs than expected when planted "late". Relative to a May 1 planting date, hybrids planted later mature approximately 6.8 fewer GDDs for every day of delay beyond May 1 (Nielsen et al., 2002). For example, a hybrid rated at 2700 GDDs from planting to physiological maturity and planted on May 31 will reach physiological maturity in less than 2500 GDDs after planting (e.g., 2700 - (30 days x 6.8)). That response of hybrid development relative to delayed planting means that normal full-maturity hybrids can be safely planted later than one would think and, consequently, means that growers can avoid switching to earlier maturity hybrids until planting dates later than one would think.
Estimating GDDs Between Two Dates at a Specific Location
The challenge in taking advantage of this relationship between hybrid GDD ratings and delayed planting lies with the estimation of available GDDs with delayed plantings for specific locations. Historical data for daily GDD accumulations exist for a limited number of weather reporting stations around the state, but accessing such data can be difficult. Currently, the Indiana State Climate Office (iClimate.org) does not offer an easy calculator for estimating the number of historical GDDs between two dates at a specific location.
The USDA-funded Useful to Usable (U2U) multi-state research and Extension project developed a GDD decision support tool that is available on the Web at https://mygeohub.org/groups/u2u/gdd. The GDD Tool estimates county-level GDD accumulations and corn development dates based on current and historical GDD data plus user selected start dates, relative hybrid maturity ratings, and freeze temperature threshold values. The GDD and corn development predictions are displayed graphically and in tabular form, plus the GDD accumulation estimates can be downloaded in a Comma Separated Value (.csv) format for you to work with in your own spreadsheet program. The GDD Tool is currently available for the states of North Dakota, South Dakota, Nebraska, Kansas, Minnesota, Iowa, Missouri, Wisconsin, Illinois, Michigan, Indiana, Ohio, Kentucky, and Tennessee.
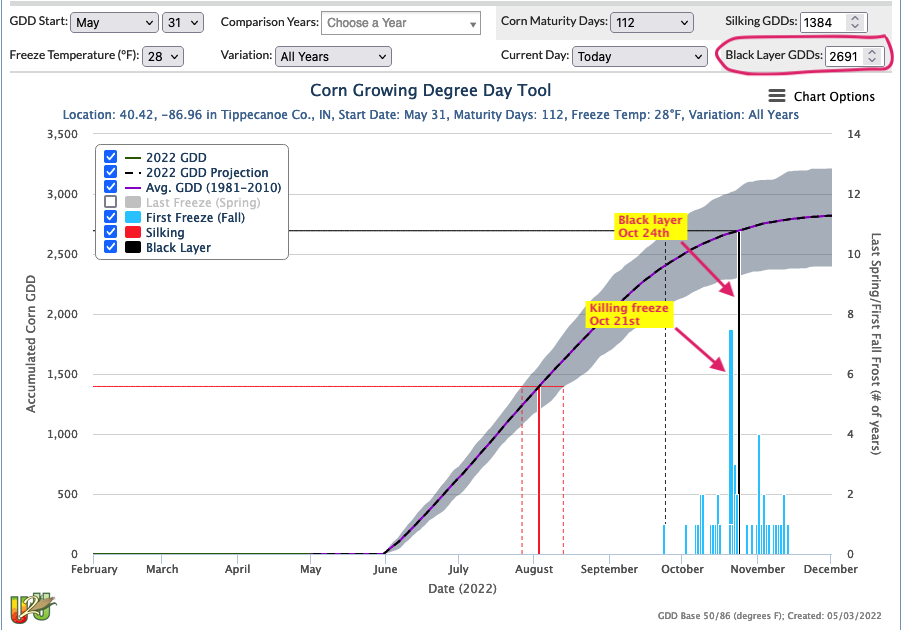
Fig. 1. Screen capture of U2U GDD Tool graphical display of historical and
estimated future GDD accumulations and predicted corn development stages for
a 112-day hybrid planted May 31 in Tippecanoe County, IN.
Figure 1 shows a screen capture from that calculator in which I selected "Tippecanoe Co., IN", a start date (aka planting date) of May 31, a relative hybrid maturity rating of 112 "days", and a freeze temperature threshold of 28F. The graph illustrates estimates of silking and black layer dates for the 112-day hybrid planted on May 31, as well as the range of the estimates. When you are viewing the actual graph on the Web site, estimates of GDD accumulations at specific dates "pop up" when you hover your computer mouse over parts of the line graph.
WORD OF CAUTION: The U2U GDD Tool does not currently account for the "wrinkle" discussed earlier in this article wherein corn hybrids typically mature in fewer GDDs than expected when planted "late" (Nielsen et al., 2002). In other words, the GDD Tool assumes the same GDDs to silking and black layer for a given hybrid maturity whether planted April 20 or May 31. Consequently, you can be led astray by the Tool if you do not modify the "Black Layer GDDs" value in the Tool's input area. For example, the screen capture displayed in Fig. 1 for a 112-day hybrid with a GDD rating of 2691 planted in Tippecanoe Co. on May 31 indicates the hybrid would mature on about October 23 when the estimated GDD accumulation exceeded 2691. If, however, you manually change the expected "Black Layer GDD" value from 2691 to 2481 GDDs (30 days after May 31 x 6.8 fewer GDDs per day delay), the GDD Tool estimates the hybrid would safely mature on about September 30, well ahead of the usual fall freeze date.
Choice of "End of Season" Date
The choice of a date to represent the "end of the season" (abbreviated EOS) can be straight-forward or one of those "eyes of the beholder" decisions. If the main concern is to identify a "safe" hybrid maturity that will reach physiological maturity before a typical fall freeze date, then the spatial maps illustrated in the accompanying figures can be used to choose that date. Figure 2 depicts the historical average dates of the first 32F temperature in the fall throughout Indiana, while Figure 3 depicts the historical average dates of the first 28F temperature in the fall throughout Indiana.
TIP: Temperatures of 32F or slightly higher typically result in leaf injury or death due to frost damage, but the corn plant technically will survive and be able to at least continue remobilizing stored carbohydrates from the stalk tissues to immature grain. A temperature of 28F for several hours is considered to be lethal for corn plants.
Some growers may opt to select an "end of season" date earlier than the historical first fall freeze date to ensure that physiological maturity will occur earlier during a time period that may yet be conducive for grain drydown in the field and thus minimize their expenses of drying the grain artificially.
Hybrid Maturity Ratings for Delayed Planting
With an estimate of available growing season GDDs in hand, one can then identify approximate relative hybrid maturities that would be suitable for delayed planting (Tables 1 and 2).
Table 1 can be used to identify "safe" hybrid maturities on the basis of their GDD ratings, though it is important to recognize that the hybrid GDD ratings in this table are for GDDs from planting to physiological maturity. Recognize that some seed companies assign GDD ratings beginning at emergence, not planting. If your seed company is one of these, then add 115 GDDs to the hybrid GDD ratings and you will be in the proverbial "ball park" using this table.
EXAMPLE: Using the U2U GDD Tool, you determine that for Blackford County, Indiana, approximately 2485 GDDs will accumulate between a delayed planting date of May 20 and a selected EOS of Sep 21. Using Table 1, the approximate "safe" hybrid GDD rating that most closely matches 2485 (the 2500 value in column 1) and the May 20 planting date (column 4) is 2629. What this means is that, for the planting date and EOS date you selected, you could safely plant a hybrid with a GDD rating of 2629 from planting to physiological maturity.
Some folks are more comfortable with the relative "days to maturity" ratings for corn hybrids (Nielsen, 2012b). Table 2 expresses the GDD values of Table 1 in terms of CRM ratings as defined by DuPont Pioneer. Recognize that I am not by any stretch of your imagination promoting Pioneer hybrids. I simply know that Pioneer assigns GDD ratings to their hybrids based on GDD accumulations between planting and physiological maturity. The mathematical relationship between their GDD ratings and their CRM ratings is pretty good and, thus, can be used to calculate approximate CRM ratings from known GDD ratings. If you are not comfortable using Pioneer's CRM ratings, then use the GDD ratings in Table 1.
EXAMPLE: If you continue on to Table 2, the approximate "safe" hybrid Pioneer CRM rating that most closely matches 2485 (the 2500 value in column 1) and the May 20 planting date (column 4) is 110. What this means is that, for the planting date and EOS date you selected, you could safely plant a hybrid with a Pioneer CRM rating of about 110.
PLEASE NOTE: Please understand that ratings for relative hybrid maturity (i.e., CRM, RM, "days to maturity", etc.) are notoriously inconsistent one seed company to another. Consequently, relationships between hybrid GDD ratings and their relative maturity ratings will vary one seed company to another. I believe the relationships listed in Table 2 are valid for Pioneer's lineup of hybrids, but cannot make the same claim for any other seed company's lineup of hybrids. Consult your seed dealer!
Caveats (e.g., disclaimers)
Recognize that actual GDDs deviate year to year from the historical "norm" because of natural variability in growing season temperatures. Also recognize that hybrids undoubtedly vary in their GDD response to delayed planting. Also recognize that hybrid GDD response to delayed planting in other parts of the country may differ from what we have documented in the eastern Corn Belt.
Fig. 2. Average first fall dates of 32F temperatures throughout Indiana.
Interpolated data derived from spatial analysis of 1981-2010 normal data from
Indiana and surrounding states. Brown: 30-Sep to 8-Oct, yellow: 9-Oct to 16-Oct;
light green: 17-Oct to 25-Oct; dark green: 26-Oct to 2-Nov; blue: 3-Nov to 11-Nov.
Spatial data source: National Climatic Data Center 1981-2010 US Normals Data.
Fig. 3. Average first fall dates of 28F temperatures throughout Indiana.
Interpolated data derived from spatial analysis of 1981-2010 normal data from
Indiana and surrounding states. White: 13-Oct to 21-Oct; Blue: 22-Oct to 30-Oct;
Green: 31-Oct to 8-Nov; Yellow: 9-Nov to 17-Nov; Red: 18-Nov to 26-Nov.
Spatial data source: National Climatic Data Center 1981-2010 US Normals Data.