Overview
Cotton, wheat, and soybeans were up; and corn was mixed for the week.
How high are prices going? It’s a refrain I have heard every day for the past month. The simple answer is I don’t know, but there are two primary factors that will dictate price direction in the current market: 1) weather and 2) export sales. Weather is currently the most intriguing as it will influence many factors, including exports, and is affecting multiple locations. Dry conditions in Brazil have delayed planting, while not at critical levels now this could affect Brazil’s soybean production and corn plantings in early 2021 (the later the soybean crop is planted the more likely that corn planting as a second crop would be delayed or abandoned). Drought in parts of France, Ukraine, and Russia have caused concern over next year’s wheat crops and are at the same time providing buoyancy to corn markets. Domestically, the drought monitor shows dry conditions intensifying in Texas, Oklahoma, Kansas, and Colorado. The weather has created some legitimate concerns over production in 2021, however global and domestic stocks are still abundant (although shrinking) and time remains for crop condition improvements.
The other key factor is export sales. China has been buying corn and soybeans at near record pace and rumors persist that they may look to purchase significant quantities of wheat as well. Purchases maybe are being partially driven buy a good faith effort to fulfill or partially fulfill obligations under the Phase One China U.S. trade agreement, but many suspect China’s stocks of grains and oilseeds may be overstated and/or the quality of the stocks are problematic. Either way additional purchases from the U.S. seem likely until there is a better understanding of South American crop conditions and potential crop availability to export markets.
You can make a very valid argument that prices could move higher as we close out 2020, but we all know how quickly weather and global politics can change markets. With cash soybean and corn prices in Tennessee now above $11 and $4.50 in some locations, I think the safer route is to sell most of your remaining 2020 production or lock in a price rather than take on the downside risk. Producers may also want to look at pricing a small amount of 2021 production if harvest futures get above $4 for corn and $10 for soybeans.
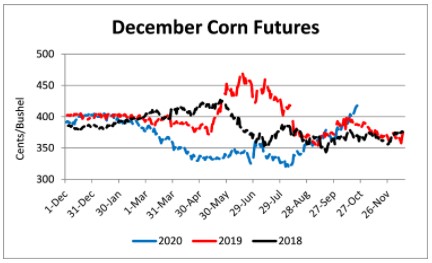
Corn
Ethanol production for the week ending October 16 was 0.913 million barrels per day, down 24,000 barrels from the previous week. Ethanol stocks were 19.721 million barrels, down 0.287 million barrels compared to last week. Corn net sales reported by exporters for October 9-15 were up compared to last week with net sales of 72.1 million bushels for the 2020/21 marketing year. Exports for the same time period were up 10% from last week at 35.4 million bushels. Corn export sales and commitments were 48% of the USDA estimated total exports for the 2020/21 marketing year (September 1 to August 31) compared to the previous 5-year average of 32%.
Corn | Dec 20 | Change | Mar 21 | Change |
Price | $4.19 | $0.17 | $4.20 | $0.13 |
Support | $4.07 | $0.10 | $4.09 | $0.07 |
Resistance | $4.23 | $0.12 | $4.24 | $0.10 |
20 Day MA | $3.92 | $0.11 | $3.99 | $0.10 |
50 Day MA | $3.72 | $0.09 | $3.81 | $0.08 |
100 Day MA | $3.54 | $0.03 | $3.65 | $0.04 |
4-Week High | $4.20 | $0.11 | $4.21 | $0.09 |
4-Week Low | $3.60 | $0.00 | $3.69 | $0.00 |
Technical Trend | Up | = | Up | = |
Nationally the Crop Progress report estimated corn condition at 61% good-to-excellent and 14% poor-to-very poor; corn mature at 97% compared to 94% last week, 82% last year, and a 5-year average of 94%; and corn harvested at 60% compared to 41% last week, 28% last year, and a 5-year average of 43%. In Tennessee, the Crop Progress report estimated corn condition at 74% good-to-excellent and 4% poor-to-very poor; and corn harvested at 83% compared to 76% last week, 95% last year, and a 5-year average of 94%. Across Tennessee, average corn basis (cash price-nearby futures price) weakened at West and strengthened or remained unchanged at Mississippi River, North-Central, West-Central, and Northwest elevators and barge point. Overall, basis for the week ranged from 20 under to 22 over, with an average of 7 over the December futures. December 2020 corn futures closed at $4.19, up 17 cents since last Friday. For the week, December 2020 corn futures traded between $4.00 and $4.20. Dec/Mar and Dec/Dec future spreads were 1 and -25 cents. Downside price protection could be obtained by purchasing a $4.20 December 2020 Put Option costing 11 cents establishing a $4.09 futures floor. In Tennessee, cash corn contracts ranged from $3.85 to $4.54. March 2021 corn futures closed at $4.20, up 13 cents since last Friday. December 2021 corn futures closed at $3.94, down 1 cent since last Friday.
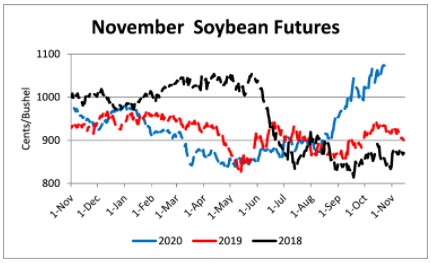
Soybeans
Net sales reported by exporters were down compared to last week with net sales of 81.8 million bushels for the 2020/21 marketing year. Exports for the same period were up 8% compared to last week at 92.5 million bushels. Soybean export sales and commitments were 76% of the USDA estimated total annual exports for the 2020/21 marketing year (September 1 to August 31), compared to the previous 5-year average of 48%.
Soybeans | Nov 20 | Change | Jan 21 | Change |
Price | $10.83 | $0.33 | $10.81 | $0.31 |
Support | $10.52 | $0.18 | $10.52 | $0.17 |
Resistance | $10.95 | $0.17 | $10.93 | $0.15 |
20 Day MA | $10.44 | $0.15 | $10.45 | $0.13 |
50 Day MA | $9.96 | $0.19 | $10.00 | $0.18 |
100 Day MA | $9.40 | $0.11 | $9.44 | $0.10 |
4-Week High | $10.88 | $0.09 | $10.86 | $0.09 |
4-Week Low | $9.85 | $0.00 | $9.90 | $0.00 |
Technical Trend | Up | = | Up | = |
Nationally the Crop Progress report estimated soybeans dropping leaves at 97% compared to 93% last week, 91% last year, and a 5-year average of 95%; and soybeans harvested at 75% compared to 61% last week, 40% last year, and a 5-year average of 58%. In Tennessee, soybean condition was estimated at 74% good-to-excellent and 4% poor-to-very poor; soybeans dropping leaves at 89% compared to 81% last week, 95% last year, and a 5-year average of 94%; and soybeans harvested at 41% compared to 31% last week, 59% last year, and a 5-year average of 53%. Across Tennessee, average soybean basis strengthened or remained unchanged at Mississippi River, West, West-Central, North-Central, and Northwest elevators and barge points. Basis ranged from 10 under to 32 over the November futures contract. Average basis at the end of the week was 17 over the November futures contract. November 2020 soybean futures closed at $10.83, up 33 cents since last Friday. For the week, November 2020 soybean futures traded between $10.47 and $10.88. Nov/Jan and Nov/Nov future spreads were -2 and -101 cents. November/December soybean-to-corn price ratio was 2.58 at the end of the week. In Tennessee, soybean cash contracts ranged from $10.44 to $11.06. January 2021 soybean futures closed at $10.81, up 31 cents since last Friday. November 2021 soybean futures closed at $9.82, up 12 cents since last Friday. Downside price protection could be achieved by purchasing a $10.00 November 2020 Put Option which would cost 69 cents and set a $9.31 futures floor. Nov/Dec 2021 soybean-to-corn price ratio was 2.49 at the end of the week.
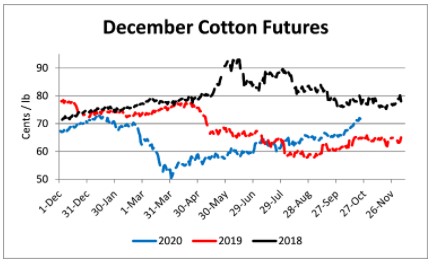
Cotton
Net sales reported by exporters were up compared to last week with net sales of 227,800 bales for the 2020/21 marketing year and 21,300 bales for the 2021/22 marketing year. Exports for the same time period were up 1% compared to last week at 194,100 bales. Upland cotton export sales were 62% of the USDA estimated total annual exports for the 2020/21 marketing year (August 1 to July 31), compared to the previous 5-year average of 55%. Delta upland cotton spot price quotes for October 22 were 68.19 cents/lb (41-4-34) and 70.44 cents/lb (31-3-35). Adjusted World Price (AWP) increased 2.28 cents to 55.71 cents.
Cotton | Dec 20 | Change | Mar 21 | Change |
Price | 71.29 | 1.37 | 71.87 | 1.31 |
Support | 70.34 | 1.73 | 71.08 | 1.73 |
Resistance | 72.90 | 2.21 | 73.36 | 2.05 |
20 Day MA | 68.29 | 1.45 | 69.03 | 1.39 |
50 Day MA | 66.32 | 0.85 | 67.16 | 0.83 |
100 Day MA | 63.99 | 0.64 | 64.74 | 0.63 |
4-Week High | 72.13 | 2.09 | 72.80 | 2.10 |
4-Week Low | 64.65 | 0.00 | 65.48 | 0.00 |
Technical Trend | Up | = | Up | = |
Nationally, the Crop Progress report estimated cotton condition at 40% good-to-excellent and 33% poor-to-very poor; cotton bolls opening at 93% compared to 90% last week, 91% last year, and a 5-year average of 89%; and cotton harvested at 34% compared to 26% last week, 38% last year, and a 5-year average of 34%. In Tennessee, cotton condition was estimated at 58% good-to-excellent and 21% poor-to-very poor; cotton bolls opening at 95% compared to 91% last week, 96% last year, and a 5-year average of 97%; and cotton harvested at 32% compared to 18% last week, 47% last year, and a 5-year average 44%. December 2020 cotton futures closed at 71.29, up 1.37 cents since last Friday. For the week, December 2020 cotton futures traded between 70 and 72.13 cents. Dec/Mar and Dec/Dec cotton futures spreads were 0.58 cents and -1.01 cents. Downside price protection could be obtained by purchasing a 72 cent December 2020 Put Option costing 1.93 cents establishing a 70.07 cent futures floor. March 2021 cotton futures closed at 71.87 cents, up 1.31 cents since last Friday. December 2021 cotton futures closed at 70.19 cents, up 0.67 cents since last Friday.
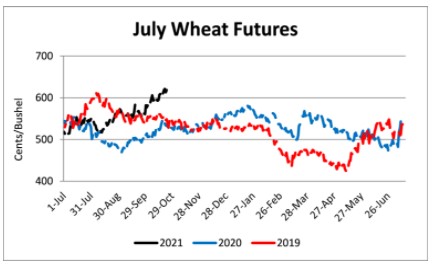
Wheat
Wheat net sales reported by exporters were down compared to last week with net sales of 13.5 million bushels for the 2020/21 marketing year. Exports for the same time period were down 62% from last week at 7.1 million bushels. Wheat export sales were 59% of the USDA estimated total annual exports for the 2020/21 marketing year (June 1 to May 31), compared to the previous 5-year average of 59%.
Wheat | Dec 20 | Change | Jul 21 | Change |
Price | $6.32 | $0.07 | $6.18 | $0.09 |
Support | $6.14 | $0.06 | $6.06 | $0.09 |
Resistance | $6.36 | -$0.03 | $6.23 | $0.05 |
20 Day MA | $5.98 | $0.19 | $5.96 | $0.14 |
50 Day MA | $5.65 | $0.12 | $5.72 | $0.10 |
100 Day MA | $5.41 | $0.05 | $5.50 | $0.03 |
4-Week High | $6.38 | $0.08 | $6.24 | $0.12 |
4-Week Low | $5.37 | $0.00 | $5.50 | $0.00 |
Technical Trend | Up | = | Up | = |
Nationally the Crop Progress report estimated winter wheat planted at 77% compared to 68% last week, 74% last year, and a 5-year average of 72%; and winter wheat emerged at 51% compared to 41% last week, 50% last year, and 5-year average of 48%. In Tennessee winter wheat planted was estimated at 41% compared to 24% last week, 31% last year, and a 5-year average of 36%; and winter wheat emerged at 22% compared to 9% last week, 10% last year, and a 5-year average of 12%. December 2020 wheat futures closed at $6.32, up 7 cents since last Friday. December 2020 wheat futures traded between $6.19 and $6.38 this week. December wheat-to-corn price ratio was 1.51. Dec/Mar and Dec/Jul future spreads were 0 and -14 cents. March 2021 wheat futures closed at $6.32, up 9 cents since last Friday. In Tennessee, new crop wheat cash contracts ranged from $5.99 to $6.31. July 2021 wheat futures closed at $6.21, up 9 cents since last Friday. Downside price protection could be obtained by purchasing a $6.20 July 2021 Put Option costing 47 cents establishing a $5.73 futures floor.