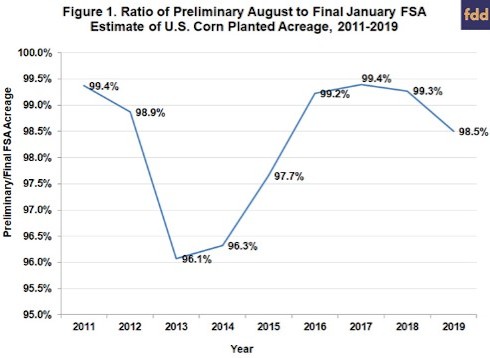
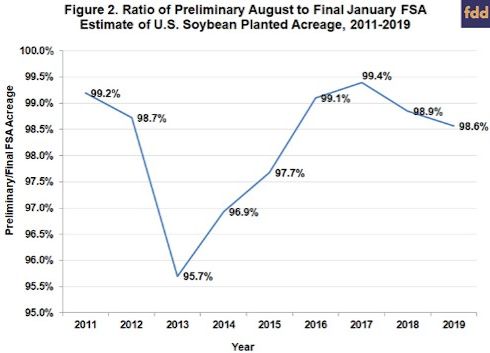
There is some variation in the relationship between preliminary and final prevented plant acreage that is obscured by the averages over 2011-2019 in Table 1. As examples, Figures 1 and 2 present the yearly ratios for corn and soybeans in August, respectively. Two things stand out. First, there was a sharp drop in reporting during 2013 and 2014, possibly due to the transition to new rules under the 2014 farm bill. Second, there is overall an upward trend in reporting for August over time. Consequently, we also present statistics for the ratio of preliminary and final planted acreage in Table 1 only for the last four years, 2016-2019. This increases the average ratio for corn and soybeans in August to 99.1 and 99.0 percent, respectively.
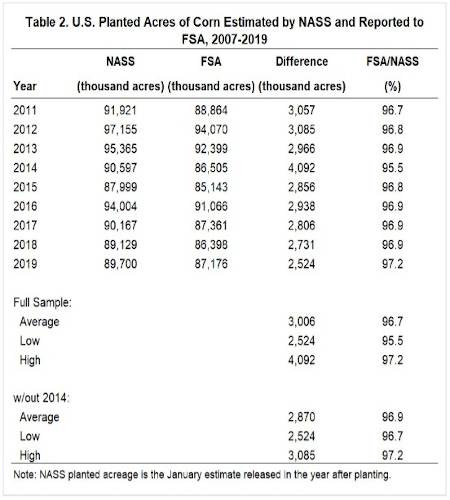
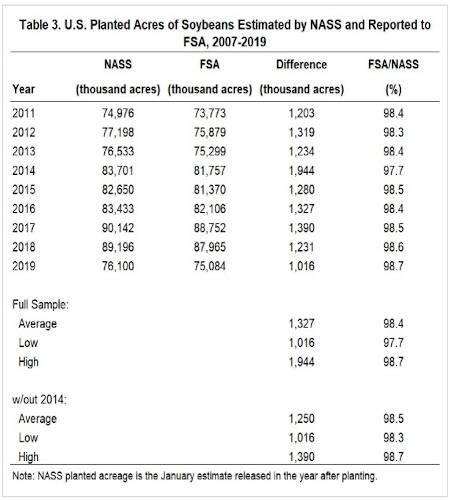
The next step of the analysis is to examine the relationship between final FSA and NASS estimates of planted acreage. Tables 2 and 3 for corn and soybeans, respectively, show that the relationships are quite consistent. For corn, the final FSA estimate of planted acreage averages 96.7 percent of final NASS planted acreage over 2011-2019 and the range is less than 2 percent. For soybeans, the final FSA estimate of planted acreage averages 98.4 percent of final NASS planted acreage over 2011-2019 and the range is only 0.5 percent. Finally, the average percentages change only slightly if the lowest observation (2014) is excluded. The consistency of the relationships make sense because enrollment in FSA farm programs varies relatively little from year-to-year.
We now have the necessary information to project final NASS planted acreage for corn and soybeans in 2020 based on the planted acreage in the August 2020 report issued by the FSA. The computations are as follows:
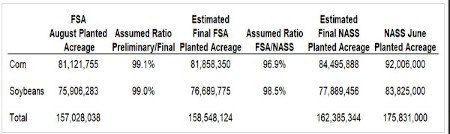
Notice that there are two stages in the computations. The first is to estimate final FSA planted acreage by dividing the reported August FSA figure by the assumed ratio of preliminary to final FSA acreage. In this case, we use the 2015-2019 averages for this ratio. The second step is estimate the final NASS planted acreage by dividing the estimated final FSA planted acreage by the assumed ratio of final FSA to NASS planted acreage. We use the averages over 2011-2019 after excluding 2014 to estimate these ratios. Given these assumptions, we estimate final NASS planted acreage for corn and soybeans to be 84.5 and 77.9 million acres, respectively. These estimates are 7.5 and 6.0 million less than the NASS June Acreage estimates for corn and soybeans, which seems very unrealistic. As noted earlier, the July 15th reporting deadline was effectively waived for 30 days this year due to the COVID-19 pandemic. The most likely explanation is therefore delayed reporting compared to the historic pattern, which implies that the historical average ratio of preliminary to final FSA estimates assumed in the calculation was too high.
As an alternative, we redo the computations but assume the lowest FSA reporting ratio for corn and soybeans that occurred over 2011-2019, which was 96.1 and 95.7 percent, respectively. The alternative computations are as follows:
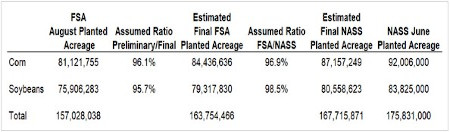
If the true reporting level for August 2020 is as assumed above, we estimate final NASS planted acreage for corn and soybeans to be 87.1 and 80.6 million acres, respectively. These estimates are 4.8 and 3.3 million less than the NASS June Acreage estimates for corn and soybeans, which still seems unrealistic.
It seems probable from the analysis that FSA reported of corn and soybean planted acreage in August 2020 was the smallest on record. We estimate the magnitude of the reporting outlier below by forcing our estimated final NASS planted acreages to equal the NASS June planted acreage and solve for the ratio of preliminary to final FSA estimates, as follows:
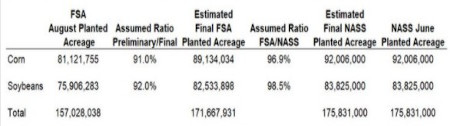
The computations shows that it takes an extremely low ratio of preliminary to final FSA acreage to reconcile the reported FSA August data with the NASS June planted acreage. In particular, the assumed ratio of preliminary to final NASS acreage has to fall to 91 and 92 percent for corn and soybeans, respectively. This is possible given the COVID-related delays in reporting and processing FSA data, but it would truly be a very large outlier compared to historical reporting patterns.
Implications
Since 2011, the USDA’s Farm Service Agency (FSA) has issued monthly reports starting in August of planted acreage based on farmer reports received and summarized to date. This data is widely following in the market for clues about possible future revisions to the official USDA planted acreage estimates for corn and soybeans. We show that all but a very small slice of planted acreage for corn and soybeans is generally reported to the FSA by August. For example, over 2011-2019 the average ratio of preliminary to final FSA planted acreage for corn and soybeans is 98.3 and 98.2 percent, respectively. We also show that the relationship between final FSA and NASS planted acreage is quite stable for the two crops. Using these relationships, we project final NASS planted acreage for corn and soybeans in 2020 based on the FSA estimates released earlier this month, which were 81.1 and 79.6 million acres, respectively. Even if one assumes the lowest level of August reporting since 2011, it is difficult to reconcile the August FSA estimates with the NASS June Acreage estimates of 92.0 and 83.8 million acres. Either reporting to FSA was substantially lower than any time in the past due to COVID-related delays or the NASS June estimates are too high. We suspect that it is some of both.
Source : illinois.edu