With that background, we now begin our examination of FAME biodiesel production profits. We will use a model of a representative Iowa biodiesel plant to assess profitability. The model is a modified version of the representative FAME biodiesel plant model developed by Don Hofstrand at Iowa State University, and it has been used in several previous farmdoc daily articles (e.g., February 5, 2020, February 3, 2021, February 16, 2022). The version of the representative biodiesel plant model used here incorporates several key assumptions:
- 30 million gallons annual biodiesel production capacity.
- Plant construction cost of $1.57 per gallon of nameplate capacity.
- 50 percent debt and 50 percent equity financing.
- 25 percent interest on a 10-year loan for debt financing, with the loan paid off in 2017.
- Plant operates at 100 percent of nameplate capacity.
- Plant only processes soybean oil into biodiesel.
- 55 pounds of soybean oil feedstock used per gallon of biodiesel.
- 9 pounds of glycerin co-product per gallon of biodiesel.
- Seven cubic feet of natural gas per gallon of biodiesel.
- 8 pounds of methanol used per gallon of biodiesel.
- Other variable input costs of 25 cents per gallon of biodiesel.
- Total fixed costs of 26 cents per gallon of biodiesel through 2017 and 20 cents per gallon thereafter.
This model is meant to be representative of an “average” plant constructed in 2007 to process soybean oil into biodiesel. There is certainly substantial variation in capacity, production efficiency, and feedstock across the industry and this should be kept in mind when viewing profit estimates from the model.
To track plant profitability over time, weekly biodiesel and soybean oil prices at Iowa plants from the Agricultural Marketing Service (AMS) were collected starting in 2007. Natural gas costs over 2007 through March 2014 are based on monthly industrial prices for Iowa available from the EIA. Due to a change in the behavior of the industrial price series, starting in April 2014, natural gas costs are based on monthly electric power consumer prices for Iowa, also from the EIA. Glycerin and methanol prices are obtained from OPIS.
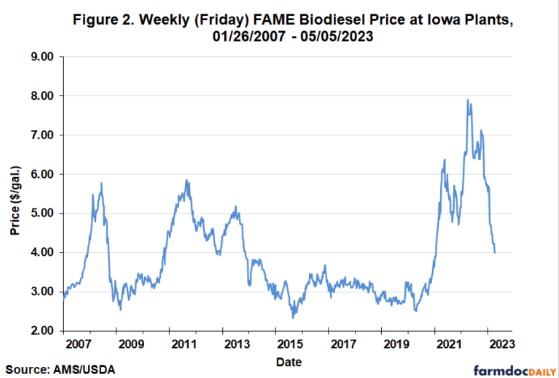
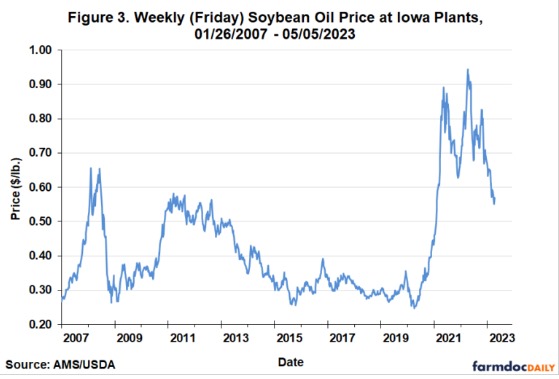
Figure 2 presents the price of FAME biodiesel—the main revenue component—on a weekly basis from January 26, 2007 through May 5, 2023. The figure reveals that biodiesel prices skyrocketed during the first phase of the renewable diesel boom, reaching an all-time high (since 2007) of $7.90 per gallon in late April 2022. Prices have since tumbled precipitously, all the way back to $4 per gallon. Figure 3 presents the price of soybean oil—the main cost component—on a weekly basis for the same period. This figure shows that soybean oil prices skyrocketed right along with FAME biodiesel prices, reaching the stunningly high level of $0.94 per pound in late April 2022. Soybean oil prices have since dropped back under $0.60 per pound.
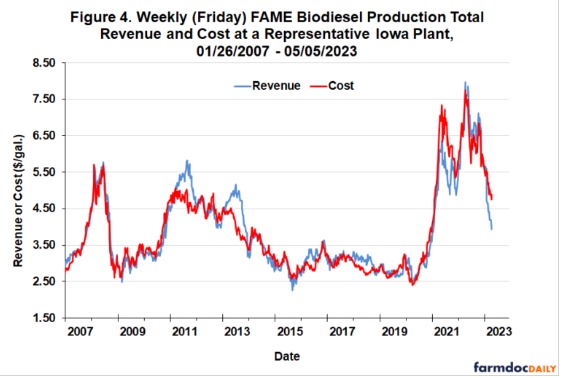
The picture that emerges is rapidly rising revenue and costs for biodiesel producers since the renewable diesel boom began in 2021. To determine whether biodiesel or soybean oil price movements dominated, Figure 4 shows total revenue and cost for the representative biodiesel plant. The general pattern since 2007 has long been for total revenue and cost to be roughly even, except for a few periods where revenue spiked above cost, such as 2011 and 2013. As the renewable diesel boom began, FAME revenue and cost were once again roughly matched, indicating that biodiesel price increases kept up with surging soybean oil feedstock prices. However, this did not last long, and revenues were below costs for much of 2021. Note that since early 2023 revenue has been running substantially below cost.
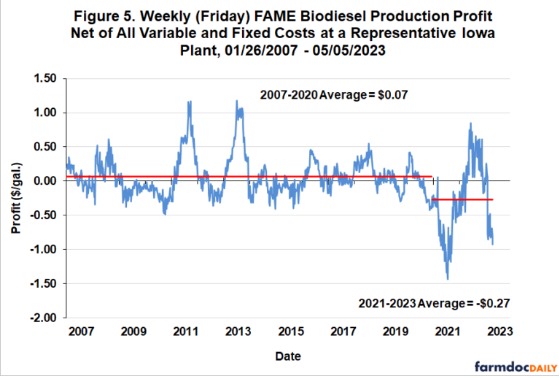
Weekly FAME biodiesel production profits (pre-tax) net of all variable and fixed costs are shown in Figure 5. This is simply the difference between the total revenue and cost presented in Figure 4. As expected, the representative plant is estimated to have operated in the red for virtually the entirety of 2021. The losses averaged -$0.65 per gallon for the year, by far the worst year for biodiesel producers since 2007. At times, losses were truly extreme, exceeding -$1 per gallon. In fact, losses for most of 2021 were larger in magnitude than any previously experienced. Somewhat surprisingly, profits rebounded in 2022 back to an average of $0.16 per gallon. While there is only anecdotal evidence in this regard, one possible explanation for the rebound is demand for renewable diesel and biodiesel blends going into California (farmdoc daily, April 19, 2023). Whatever the underlying reason, the rebound was short-lived as profits plunged once again in 2023, averaging -$0.43 per gallon (to date).
Overall, FAME biodiesel production profits clearly have been squeezed substantially by the competition from renewable diesel since 2021. This is highlighted by the downward shift in average profits before and after 2021 in Figure 5. Over 2007-2020, the average profit for the representative plant was $0.07 per gallon. The average plunged to -$0.27 per gallon over 2021-2023 (to date). The magnitude of the average loss during the renewable diesel boom was nearly quadruple the average gain before the boom.
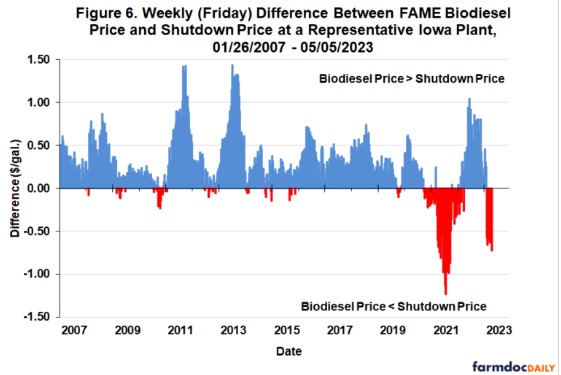
It is clear that FAME biodiesel production losses have been severe for much of the time since the renewable diesel boom began. The severity is illustrated in a different manner in Figure 6, which presents the difference between weekly FAME biodiesel prices at the representative Iowa plant and a computed shutdown price. We define the shutdown price to be the biodiesel price net of marketing costs equal to the variable cost of production net of glycerin revenue. This is based on the classical economic theory of the firm, which predicts that production should cease if price does not cover average variable cost. In the chart, positive blue bars indicate the biodiesel price is above the shutdown price. Likewise, negative red bars indicate the biodiesel price is below the shutdown price. This is perhaps the most dramatic evidence of the impact of the renewable diesel boom on the FAME biodiesel industry. Before the boom, it was exceeding rare for biodiesel prices to dip below shutdown prices, but this has been the norm much of the time since the boom started in 2021. The contrast could not be starker.
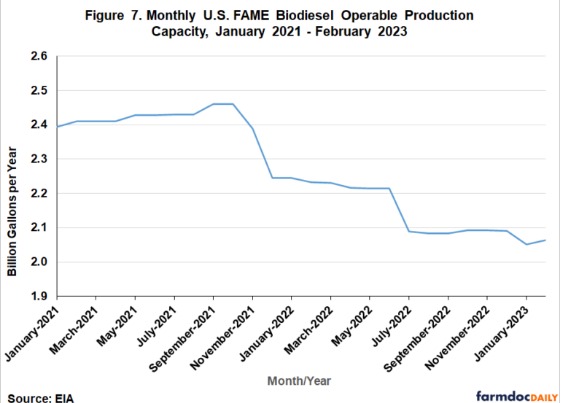
In the face of such strong shutdown signals, it would be surprising if at least some biodiesel production capacity was not taken offline the last couple of years. The Energy Information Agency (EIA) of the Department of Energy publishes data on the “operable” capacity of FAME biodiesel plants in the Monthly Biofuels Capacity and Feedstocks Update. Figure 7 shows the EIA estimates of FAME biodiesel operable capacity for January 2021 through February 2023. Operable capacity has fallen as predicted, declining from a high of 2.461 billion gallons in October 2021 to a low of 2.051 billion gallons in January 2023. This is a decline of nearly 17 percent in a relatively short time.
Implications
The impact of the renewable diesel boom on FAME biodiesel producers has not received much attention. The evidence presented here shows that competition from rapidly rising renewable diesel production has dramatically squeezed biodiesel production profits since 2021. For example, the average profit for a representative Iowa FAME biodiesel plant over 2007-2020 was estimated to be $0.07 per gallon. With the onset of the renewable diesel boom, average profit plunged to -$0.27 per gallon over 2021-2023 (to date). The magnitude of the average loss during the renewable diesel boom was nearly quadruple the average gain before the boom. Even more ominously, biodiesel prices have been below plant shutdown prices for much of the time since the renewable diesel boom started in 2021. While some FAME biodiesel production capacity has been taken offline in the last couple of years, given the scale of the losses, it is somewhat surprising that even more capacity has not been mothballed. It may be that the biodiesel industry was buoyed by a period of profits in 2022 and this contributed to the ability of plants to hang on in the face of the onslaught from renewable diesel production. However, if recent trends persist, it is only a matter of time before more and more biodiesel plants are forced to shut down.
Source : illinois.edu