Table 1. Respondents’ Characteristics (November 2022)
| | % of Respondents |
| Gender | |
| Male | 49.3% |
| Female | 50.5% |
| Non-Binary/Third Gender | 0.2% |
| Age | |
| 18-24 | 13.6% |
| 25-34 | 18.0% |
| 35-44 | 15.9% |
| 45-54 | 17.0% |
| 55-64 | 16.2% |
| 65+ | 19.3% |
| Annual Household Income | |
| Less than $25,000 | 18.0% |
| $25,000-$49,999 | 22.7% |
| $50,000-$74,999 | 18.7% |
| $75,000-$99,999 | 13.7% |
| $100,000-$149,999 | 14.5% |
| $150,000-$199,999 | 6.2% |
| $200,000 or more | 6.1% |
| Census Region | |
| Northeast | 16.3% |
| South | 38.6% |
| Midwest | 21.2% |
| West | 23.9% |
Trust in Food System and Support for Farm Policy
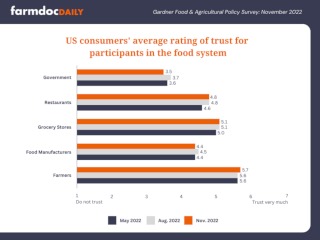
One measure the Gardner Food and Agricultural Policy Survey tracks is public trust for different groups in the food system (farmers, food manufacturers, grocery stores, restaurants, and government), which is measured on a scale from 1 (do not trust) to 7 (trust very much). Figure 1 shows the average trust ratings across the three survey quarters for each group, which has remained very consistent across the three panels.
Figure 1. Average Trust Ratings for Groups Along the Food System
Related to trust in food system groups, the Gardner Food and Agricultural Policy survey tracks measures related to farm policy. We ask consumers about six situations for which farmers might receive government support. Table 2 compares the proportion of consumers who agree the government should support farmers in each situation and across all three quarters. Support remains highest for payments following natural disasters and improving affordability of crop insurance across all three quarters. Support for payments when farmers adopt sustainable production practices is also quite high across all three quarters.
Table 2. Proportion of US Consumers That Support Farmers Receiving Financial Support from the Government in Different Situations
| | Quarter 1 (May 2022) | Quarter 2 (August 2022) | Quarter 3 (November 2022) |
| A natural disaster (e.g., hurricane, tornado) harms a farmer’s crop(s) | 79.5% | 78.8% | 82.8% |
| Crop prices are considered too low | 45.9% | 42.0% | 43.6% |
| Farmers adopt sustainable production practices | 69.8% | 65.9% | 69.7% |
| To make crop insurance protection more affordable for farmers | 73.4% | 72.9% | 76.3% |
| Agricultural trade or export restrictions | 49.7% | 50.9% | 52.2% |
| To provide income to farmers | 57.1% | 59.8% | 58.6% |
Beliefs about the Food System and Inflation
We also track beliefs about the food system. Each consumer is asked the extent to which they agree or disagree with seven statements about the food system on a five-point scale from strongly agree (5) to strongly disagree (1). We summarize these results in Figure 2, by presenting the proportion of US consumers surveyed that agreed (strongly agreed or somewhat agreed) with each of the statements. We find that beliefs about the food system stayed relatively constant. In line with recent inflation, we do find reductions in the proportion of consumers who believe the food system is affordable in November 2022 (55.2%) compared to both May 2022 and August 2022 (59.0% and 59.1%, respectively).
Figure 2. Proportion of Consumers That Agree with Statements about the Food System
To understand US consumers’ experiences with inflation, we asked a series of questions about how rising prices had impacted them in the last month. It is well-documented that rising food prices tend to be most impactful on consumers with low incomes, who spend a larger percent of their income on food. News reports have highlighted that rising food prices may mean reduced access to nutritious foods, which has implications for food security and health (e.g., Fu, 2022; Wiener-Bronner, 2022). We highlight how responses differ across food security status below using the USDA 6-item food security scale with income-based adjustments (Ahn, Smith, and Norwood, 2020). We note that our panel surveyed a higher rate of food insecure households than USDA estimates, with nearly 72.8% experiencing high or marginal food security, 14.5% experiencing low food security and 12.7% experiencing very low food security.
We began by asking consumers to rate the extent they felt inflation had affected them in the last month from 0 (not affected) to 10 (highly affected). On average, consumers indicated 6.8. Less food secure households indicated that they felt more affected by inflation, those with very low food security status had an average rating of 8.2. By comparison, those with low food security status and those with high or marginal food security status had an average rating of 6.6. We also asked consumers to compare how inflation was affecting them now, compared to three months ago (August 2022). Most consumers indicated inflation was affecting them more now than it was in August (66.9%). Fewer said inflation was affecting them about the same now as in August (30.0%) and very few said inflation was affecting them less now than in August (3.2%).
To add important context for policy, we also investigate this by food security status and find that households with very low food security indicated things were worse now than in August at a much higher rate (see Figure 3).
Figure 3. Proportion of Consumers Who Indicated Inflation Is Affecting Them Now (November 2022) More than in August 2022, by Food Security Status
Conclusion
The third quarter panel (November 2022) of the Gardner Food and Agricultural Policy Survey returned very consistent, stable responses from consumers on who they most trust in the food system and their views of when farmers should receive assistance, as compared to May 2022 and August 2022. Similarly, consumer views about the US food system also remained quite consistent. In line with recent inflation, we do see a reduction in the proportion of consumers who agreed the food system produces food that is affordable, and we included initial findings about inflation; as expected, those with lower food security status have been much more impacted by inflation. Our next article will review the responses about inflation in more depth and detail.
Source : illinois.edu