Some context for the figures cited above is helpful. The 20-year historical average increase in the price of food is 2.4%. The 3-4% increase in 2021 that USDA is forecasting is not out of the realm of what we have observed historically. The 20-year historical average for beef, pork, and poultry prices is 4.4%, 2.2%, and 2.1%, respectively. The increase in meat prices this year is noticeably higher. However, USDA expects retail meat prices to moderate in 2022, averaging 2.5% higher compared to 2021.
A common concern is that the record-setting beef prices in 2021 will hurt beef demand. Unfortunately, without context, nominal meat prices provide few insights about beef demand. For demand analysis, what we really care about is relative prices. The textbook demand graph illustrates the relationship between quantity and the relative value of a good. For example, per capita beef consumption and the relative price of retail beef.
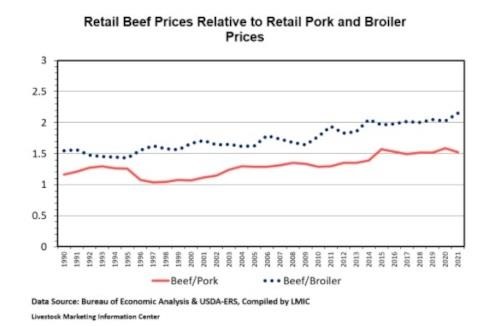
One way to determine how the relative price of beef has changed is to calculate price ratios between beef and other proteins like pork and poultry. The second figure in this article plots the all-fresh retail beef price relative to retail pork and composite broiler prices. In general, the price relationships have remained stable for the 2014-2020 period, with beef prices averaging 1.5 times the price of pork and 2.0 times the price of broiler meat. In 2021, the retail beef/pork and beef/broiler price ratios have averaged 1.5 and 2.1, respectively. I would be more concerned about beef demand prospects if the relative value of beef changed dramatically in 2021. The data shows that it has not.

Source : osu.edu