Early in the 87th Congress, the Agriculture Committees moved quickly to respond to this situation and Congress enacted the Emergency Feed Grains Program for 1961 (P.L. 87-5). This program required that for corn and grain sorghum farmers to be eligible to receive price support loans they had to participate in a newly designed “special agricultural conservation program” that was added into the standing Soil Conservation and Domestic Allotment Act. The special agricultural conservation program provided conservation payments in cash or an equivalent amount in kind for the greater of a 20-acre reduction or a 20% reduction in acres planted to corn or grain sorghum on the farm in 1961 compared to the average planted in 1959 and 1960. The farmer could receive a Payment-in-Kind (PIK) only for up to an additional 20% reduction in acres. PIK was made using negotiable certificates from the Commodity Credit Corporation (CCC) that could be redeemed for commodities owned and stored by the CCC
The PIK concept traces to the acreage reserve program of the 1956 Soil Bank and it would end up being in operation for the entire decade of the 1960s. Congress extended the program for the 1962 crop by the Agricultural Act of 1961 (P.L. 87-128). The controversial Food and Agricultural Act of 1962 extended the feed grains program for another year to cover the 1963 crop, added barley, and amended the price support component to include $0.18 per bushel of the total support price from PIK (P.L. 87-703). In 1963, the program was extended yet again, this time for the 1964 and 1965 crop years by the Feed Grain Act of 1963, while also adding oats and rye and placing restrictions on diverting acres to other crops (P.L. 88-26). The Food and Agricultural Act of 1965 generally extended the program through the 1969 crop and expanded the eligible acreage to the greater of 25 acres or 50% of the 1959 and 1960 average acreage (P.L. 89-32). Finally, Congress extended the program for another crop year (1970) in an amendment to the 1965 Act that was enacted in October 1968 (P.L. 90-559).
By comparison, the 1983 version of PIK was implemented by the Reagan Administration and not specifically authorized by Congress. The Comptroller General’s report to Congress on the program stated that USDA announced the program on January 11, 1983, and it covered corn, grain sorghum, wheat, rice and cotton (GAO-RCED-85-89). The 1983 PIK was created administratively using long-standing authorities under the Agricultural Act of 1949; USDA’s reasoning was that the 1981 Farm Bill’s farm programs—including acreage reduction—were not improving prices or controlling supplies. In particular, the 1982 acreage reduction program failed to offset yield increases and farmers harvested larger crops than in 1981, resulting in large carryovers and lower prices which triggered large deficiency payments and resulted in forfeitures to the CCC under the loan programs. USDA envisioned PIK in 1983 as a lower cost option given the trend towards lower prices, higher deficiency payments and additional forfeitures.
As designed, farmers would reduce planted acres as prescribed by USDA and receive negotiable certificates for CCC-owned stocks in place of harvested crops from the reduced acres; however, GAO found that “USDA did not have enough CCC-owned stocks of wheat, corn, grain sorghum, and cotton available” and had to purchase additional quantities of these commodities from farmers (GAO-RCED-85-89, at 7). This led to further problems with the programs, including an increase in the cost of operations. GAO reported that 49.2 million additional acres of corn, grain sorghum, wheat, rice and cotton were taken out of production in 1983—this was in addition to the 26.8 million acres removed from production under existing farm programs—at a cost of between $9.8 billion and $10.9 billion (between $25.9 billion and $28.8 billion adjusted for inflation to 2020 dollars). GAO also concluded that “the 1983 summer drought played a major role, although a lesser one than the PIK program, in reducing total PIK commodity ending stock levels”; a 62.4% total reduction in ending stocks of all PIK commodities attributed 35.5% to PIK and 26.9% to drought (GAO-RCED-85-89, at 32-33). In addition to its cost, GAO found that the program had mixed success with numerous complications and problems, including that USDA had concluded that the $50,000 payment limit from the farm bill did not apply to PIK.
Figure 1 traces the acres removed from production by PIK and set aside policies as reported by ERS and discussed previously (farmdoc daily, November 14, 2019; Bigelow and Borchers, ERS 2017). The 1983 PIK program clearly stands out in Figure 1 as part of the total set aside reduction by almost 78 million acres.
Discussion
If the policy goals for set aside or acreage reduction policies generally is to control production in order to avoid surplus supplies and the depressing impact they have on prices and farm income, then the success or failure of such policies can be measured against those policy goals. Against those goals, one way to measure set aside or acreage reduction policy’s success could be the following: (1) whether the removed the acres from production as intended; (2) whether the result was a decrease in overall production to avoid surplus; and (3) whether market prices or farm incomes improve as a result.
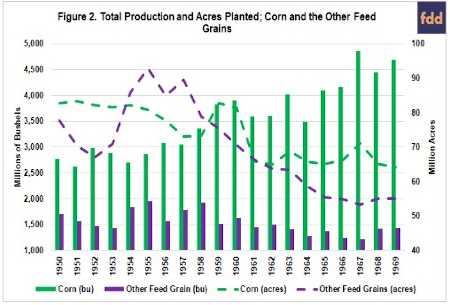
The 1960s PIK programs were focused on corn and the other feed grains (barley, oats, rye and grain sorghum). Figure 2 illustrates planted acres for corn and these other feed grains as well as the total national production for the years 1950 to 1969. Figure 2 therefore covers the Soil Bank (1956 to 195) and the PIK programs beginning in 1961. The PIK programs clearly reduced acres planted to corn and the other feed grains but were less successful in reducing corn production. Corn production generally increased during this time as a result of the continued improvement in yields.
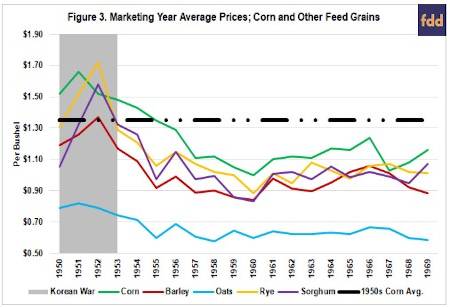
If the third measure of effectiveness for the policy is limited to crop prices, then based on the Marketing Year Average (MYA) of prices received by farmers for the commodities, the PIK programs were not effective. Average prices did not improve noticeably in the 1960s and certainly did not match price levels during the Korean War. Figure 3 illustrates MYA prices for corn, barley, oats, rye and sorghum, as well as the average corn MYA prices from 1950 to 1959. For corn, the MYA prices in the 1960s did not reach the $1.29 per bushel experienced in 1956. Neither the Soil Bank (1956 to 1959) nor the PIK program achieved an increase in corn prices.
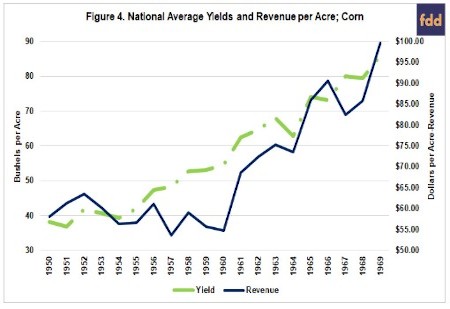
If, however, the third measure for the effectiveness of the policy is based on crop revenue (combining prices and yields), the conclusion changes to some degree. Figure 4 compares the national average revenue for corn in the years 1950 to 1969 based on the MYA prices and national average yields. Figure 4 also illustrates the national average yields for corn and the significant increases experienced during this era. Revenues clearly improved after 1960. How much can be attributed to the PIK/set aside policy is a question for further analysis.
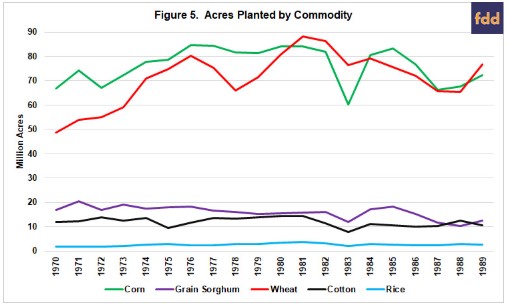
By comparison, the 1983 PIK program operated only single year and applied to corn, grain sorghum, wheat, cotton and rice. Figure 5 illustrates the measure of effectiveness based on reducing acres planted to these commodities with total acres planted each year from 1970 to 1989; acres in 1983 were reduced across the board and especially for corn. Looking closer, the acres planted in 1983 can be compared to the average acres planted to the commodity during 1980 to 1982. The years 1980 to 1982 correspond with the peak acres planted to these commodities and in total cropland (farmdoc daily, June 26, 2020, at Figure 2; April 9, 2020, at Figure 1). Acres planted to corn were 23 million (-27.75%) less than the 1980 to 1982 average, acres planted to grain sorghum were 4 million (-25%) less, acres to wheat were 8.7 million (-10%) less, while acres planted to cotton were down 5.5 million acres (-42%) and for rice, 1.3 million (-37%). The 1983 program reduced corn acres the most but as a share of recent years it was most effective for cotton and rice by this measure.
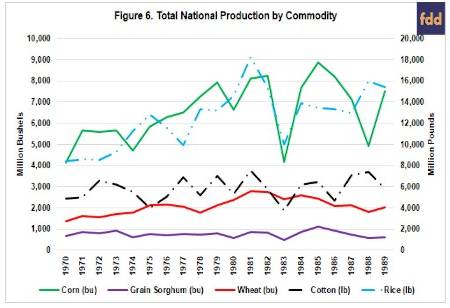
By the second measure, reductions in total production, Figure 6 illustrates corn, grain sorghum and wheat production in millions of bushels (green, purple and red solid lines, respectively) and cotton and rice production in millions of pounds (black and light blue dot-dash lines, respectively). As compared to the average production in 1980 to 1982, corn production fell the most; a 3.5-billion-bushel reduction (-45.5%) in 1983. Cotton and rice production each fell by nearly 40% as compared to 1980 to 1982 average production.
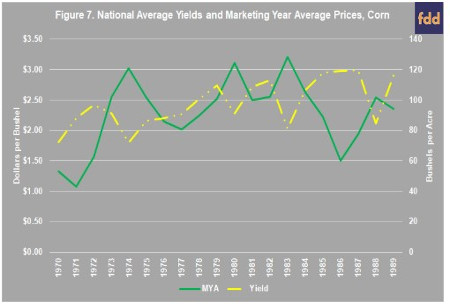
Looking closer at corn, Figure 7 illustrates national average yields and marketing year average prices. It supports the GAO conclusion that a drought in 1983 contributed to reduced yields and production. The combination pushed prices up in 1983 for corn ($3.21 per bushel), however, national average revenue fell by nearly $21 per acre ($260.33) compared to the average revenue from 1980 to 1982 ($281.31). None of the impacts on production, yield or prices outlasted the single year of the program; by 1986 production was near the all-time high, as were yields; prices and revenues had collapsed to the lowest levels since 1971.
Concluding Thoughts
The Payment-in-Kind policy offers a different version of efforts to reduce acres to increase prices; a method of paying farmers that took advantage of surplus supplies and would be generally unavailable in the current programs. In short, set aside policies can be effective in reducing planted acres to the commodities subject to the policy if paired with a sufficient amount (or kind) of assistance. Effectiveness in reducing production is more questionable and uncertain because much depends on yields; actual yields in any given crop year are highly dependent upon weather and production practices. To date, set aside policies have not sought to control technology or production practices and, of course, no policy can control the weather. Without better control over production, it is not surprising that economic analysis of the policy—particularly as it looks to prices, revenue and income—will almost always conclude that such policies are only partially effective, at best. Finally, a secondary conclusion from the comparison between the 1960s and 1983 PIK programs is that set aside policies likely require multiple years of operation to gauge effectiveness but, as in the 1960s, the acreage reductions can easily be offset by yield increases and fail to control production or improve prices.
Source : illinois.edu