By Scott Irwin
Department of Agricultural and Consumer Economics
University of Illinois
The impact of small refinery exemptions (SREs) under the RFS continues to be a highly controversial subject. While there is no doubt that SREs have opened a backdoor mechanism for the EPA to reduce the statutory and obligated RFS volumes (farmdoc daily,
July 12, 2018), there is sharp disagreement about the impact of SREs on the physical consumption of ethanol. Some argue that physical ethanol demand has been unaffected, while others argue there has been substantial destruction of demand in the physical ethanol market due to the SREs. An earlier farmdoc daily article (
September 13, 2018) reported little evidence that the blend rate for ethanol had been reduced by SREs through June 2018. Since the impact of SREs likely started no earlier than December 2017, it is important to revisit the issue with more up-to-date data. The purpose of this article is to investigate the impact of SREs on demand for ethanol in the physical market using data through September 2018. In addition, the reason for the extreme volatility in the implied ethanol blend rate during the second half of 2017 and the first half of 2018 is investigated.
Analysis
When the U.S. Congress first created the RFS in the Energy Policy Act of 2005
(P.L. 109-58) it included a temporary exemption for small refineries from the mandate through 2011. Under the Obama Administration, SREs were rarely granted after 2011. This changed radically under the Trump Administration, which granted a total of 48 SREs retroactively for 2016 and 2017. As detailed in this farmdoc daily article (
July 12, 2018), SREs effectively reduced the conventional ethanol mandate for 2017 from 15 billion gallons to 13.9 billion gallons. This was not only a large reduction in absolute terms, but it also resulted in the conventional mandate being set below the E10 blend wall. If similar numbers of SREs are granted for 2018 and 2019, comparable reductions in the effective conventional ethanol mandate should be expected (assuming the SRE volumes are not reallocated to non-exempt obligated parties).
We examine here two of the three measures of the ethanol blend rate used in the farmodc daily article of
September 13, 2018 in order to test the impact of SREs on ethanol demand. We do not consider the blend rate measure that includes gasoline exports here because of concerns about the noise added by gasoline exports. The first measure of the ethanol blend rate is based directly on EIA surveys. The numerator is U.S. refiner and blender net input of ethanol in gasoline and the denominator is U.S. refiner and blender net production of motor gasoline that is blended with ethanol. In other words, if a gallon of gasoline contains ethanol then it is counted in the denominator of this measure. Potential limitations of this first measure of the ethanol blend rate are twofold: i) it does not reflect ethanol blended outside of the refiners and blenders surveyed by the EIA; and ii) the survey on gasoline blending does not reflect E0 consumption. Both could bias the measure of the blend rate.
The second measure of the ethanol blend rate attempts to correct for the two sources of bias mentioned above by using more inclusive measures of physical ethanol and gasoline consumption. Rather than being a direct survey estimate, ethanol consumption for the second measure is implied based on the ethanol balance sheet as follows:
Domestic Use = Beginning Stocks + Production + Imports – Exports – Ending Stocks.
This measure of physical ethanol consumption in theory includes all domestic sources (E10, E15, and E85) in the numerator of the blend rate. However, it also may be subject to more measurement error since consumption is implied. Finished motor gasoline consumption is implied in a similar manner by the EIA, and therefore E0 consumption is included in the denominator of this version of the blend rate.
Figure 1 presents the first measure of the ethanol blend rate on a monthly basis over January 2007 through September 2018. Based on this data, the ethanol blend rate started relatively high, a bit higher than 9 percent in 2007, rose quickly to around 10.5 percent in 2010, and then stayed remarkably stable through September 2018. The blend rate exceeds 10 percent with this measure because higher ethanol blends such as E15 and E85 are included in the accounting but 100 percent petroleum gasoline (E0) is not. There does not appear to be any perceptible change in the average ethanol blend rate with this measure during 2017 or 2018.
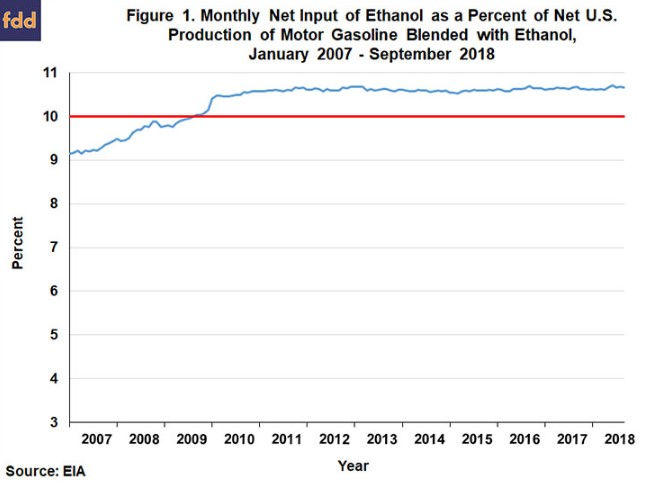
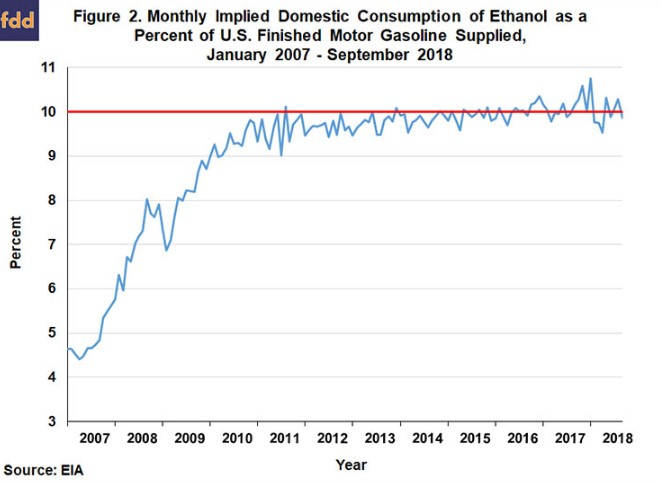
Figure 2 presents the second (“implied”) measure of the ethanol blend rate on a monthly basis over January 2007 through September 2018. As expected, this measure is noisier than the first one. It also starts at a much lower level because of the large amounts of E0 that were being consumed in the early part of the sample. This measure of the ethanol blend rate started to consistently hit 10 percent in 2013 and has generally been in a fairly tight range near 10 percent ever since. There is an unusual amount of volatility in this measure of the blend rate starting in November 2017 when it hit 10.6 percent, reached another peak of 10.8 percent in January 2018, dropped back to 9.5 percent in April 2018, and then recovered back to near 10 percent. Once again, there does not appear to be any perceptible change in the average ethanol blend rate during 2017 or 2018 with this second measure.
In order to more formally analyze changes in ethanol blend rates in relation to SREs, average blend rates for various breakpoints are presented in Table 1. The first breakpoint is December 2017, which is when the price of D6 RINs began to decline sharply. The argument is that granting of SREs increased the supply of RINs substantially and caused a large decline in RIN prices. This in turn is allegeded to have reduced incentives for physical blending of ethanol. Averages are computed for the 10 months before and after December 2017. The second breakpoint is February 2018, when the implied blend rate dropped sharply. In this case, averages are computed for the same February-September period in 2017 and 2018. The third breakpoint is January 2018 in order to compute year-to-date average blend rates for 2017 and 2018.
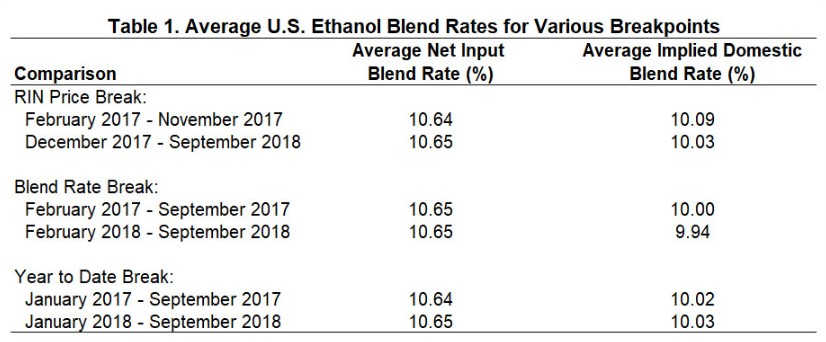
Regardless of the break point considered, Table 1 shows that the average ethanol blend rate based on net inputs (first measure) is virtually unchanged at 10.64 or 10.65 percent. There is some evidence of a very slight decline in the average implied blend rate (second measure) depending on the breakpoint considered. Both the RIN price (December 2017) and the blend rate (February 2018) breaks show declines in the average blend rate of 0.06 percent. It is important to keep in mind that the decline in average rates is less than one-tenth of a percent in these cases. The year-to-date comparison shows almost no difference in average implied blend rates for 2018 versus 2017.
Overall, the comparisons in Table 1 provide very little evidence that the blend rate for ethanol has been reduced by SREs. If there has been any physical ethanol “demand destruction” to date it has been very, very small, perhaps a drop in the ethanol blend rate of a half-a-tenth or so, which equates to only about 70 million gallons of ethanol consumption on an annual basis. This may seem counter-intuitive given the magnitude of the impact of SREs in reducing the conventional ethanol mandate and the precipitous drop in D6 RINs prices that followed. As discussed in the farmdoc daily article on September 13, the answer is simply that all but a tiny sliver of domestic ethanol is consumed in the form of E10 and ethanol is highly price competitive in the E10 gasoline blend in the U.S. The implication is that the conventional ethanol mandate up to the E10 blend wall is non-binding, and therefore, SREs should not have any impact on this component of domestic ethanol demand. This is not the case for E15 and E85 demand, which should be highly sensitive to the price of D6 RINs. However, the amount of ethanol consumed in the form of these higher blends is so small that any RIN price incentive effect barely registers in the aggregate amount of ethanol consumed in the U.S.
One remaining issue is the extreme volatility of the implied ethanol blend rate (Figure 2) in the second half of 2017 and the first half of 2018. It is possible that some of the sharp decline in this measure of the blend rate in early 2018 is related to SREs and the D6 incentive effect, but since the decline in the blend rate was not sustained, this argument is not persuasive. In addition, the D6 incentive effect cannot explain the sharp increase in the implied blend rate in the second half of 2017. The likely explanation is measurement error in EIA export surveys. The issue is coverage of ethanol in rail transit in EIA export surveys. Ethanol being transported by rail for export should be counted in the current EIA production survey as having been produced but it may not yet be counted as exported in the EIA export survey because it is in transit. This has the effect of inflating implied domestic use of ethanol in the current month because ethanol that is produced has to be balanced by usage. The impact on implied domestic use is reversed in the following month when the ethanol in transit is properly counted as part of exports. Of course, the larger the amount of ethanol in rail transit for exports the large the impact on implied domestic use. It is interesting to note that exactly the same issue arises in grain markets when implying feed and residual use (Irwin, Sanders, and Good, 2014).
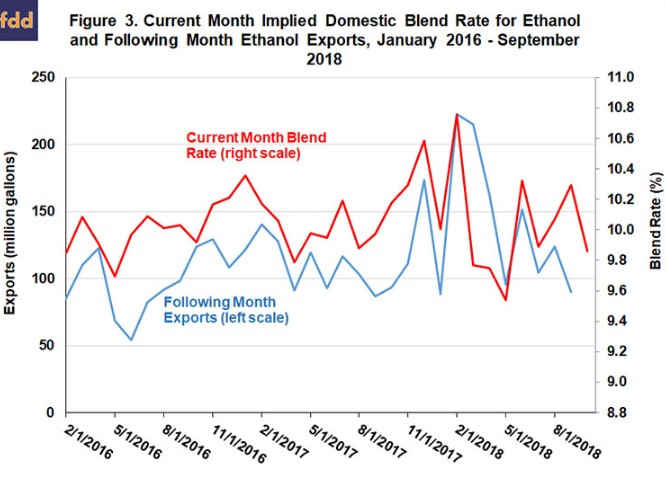
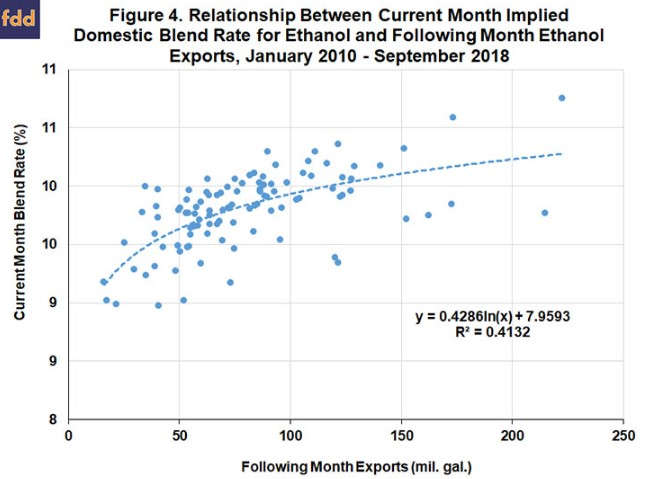
Figure 3 provides confirmation that measurement errors in the EIA export survey are the likely culprit in explaining the volatility in the implied domestic blend rate in the second half of 2017 and first half of 2018. The red line in the figure is the implied domestic blend rate in the current month and the blue line is ethanol exports in the following month. There is clearly a positive relationship between the current implied blend rate and the following month’s exports, consistent with the logic laid out in the previous paragraph. In particular, the surge in ethanol exports in the second half of 2017 and early 2018 must have been associated with large amounts of ethanol in transit for ethanol. This created the appearance of a surge in implied domestic ethanol use and the implied ethanol blend rate over this same time period. Once the surge in ethanol exports receded, there was a compensating drop in implied domestic ethanol use and the implied ethanol blend rate. While this episode is a dramatic illustration of the impact of measurement errors on implied ethanol blend rates, Figure 4 shows this is not an isolated phenomenon, but, rather, a systematic tendency in the data for some time.
Implications
There is widespread interest in whether small refinery exemptions (SREs) under the RFS have “destroyed” demand for ethanol in the physical market. It seems obvious that this would be the case since SREs have the effect of waiving more than a billion gallons of the conventional ethanol mandate under the RFS. The updated analysis in this article shows even less evidence that the blend rate for ethanol has been reduced by SREs. If there has been any ethanol “demand destruction” to date it was very, very small, perhaps a drop in the ethanol blend rate of a half-a-tenth or so, which equates to only about 70 million gallons of ethanol consumption on an annual basis. The reason for this counter-intuitive result is that all but a tiny sliver of ethanol in the U.S. is consumed in the form of E10 and ethanol is very price competitive in the E10 gasoline blend. This article also shows how measurement errors in the EIA export survey likely explain the extreme volatility of the implied domestic blend rate in the second half of 2017 and first half of 2018.
As discussed previously (farmdoc daily,
September 13, 2018), the finding that SREs have not had a material impact on physical ethanol demand to date does not necessarily mean that all biofuels demand has been unaffected. First, the drop in RIN prices associated with SREs should have reduced E15 and E85 demand. While the magnitude of this impact is very small now, it also precludes further expansion in the demand for higher ethanol blends so long as SREs are granted (and not reallocated). Second, the demand for biomass-based diesel in all likelihood has been reduced in direct proportion to the impact of SREs on total obligated gasoline and diesel gallons because the biomass-based diesel mandate is highly binding.