By Scott Irwin
Department of Agricultural and Consumer Economics
University of Illinois
The USDA released the 2021 Prospective Plantings report on March 31st. The report indicated that U.S. farmers intended to plant 91.444 million acres of corn and 87.6 million acres of soybeans this year. The market reaction to the release of the report was stunning, with both corn and soybean futures increasing the daily allowable limit. The purpose of this article is to provide historical perspective on the magnitude of the corn and soybean acreage surprises contained in last week’s Prospective Planting report. The analysis complements that found in a farmdoc daily article (
April 5, 2021) earlier this week.
Analysis
The first step in the analysis is to define what we mean by an acreage “surprise.” Simply put, this is the difference between the average market expectation for planted acreage before the Prospective Plantings report is released and the USDA estimate of planted acreage released in the report. Market expectations are collected by news services like Bloomberg and Reuters and an average of the expectations is often used by traders and academics alike to represent the market consensus before an important USDA report is released. We use a series of average market acreage expectations before Prospective Plantings reports over 1983-2021. Because the level of corn and soybean acreage has increased over time, the percentage difference between average acreage expectations and USDA estimates is used for the analysis.
Figures 1 and 2 show planted acreage surprises for corn and soybeans, respectively, over 1983-2021. Note that a positive percentage surprise is considered bearish because this implies that the USDA acreage estimate is larger than the average market expectation, and vice versa. Notice how close the average market surprise is to zero for both corn and soybeans. There is a slight bias to bullish acreage surprises in soybeans (-700k acres), but this is insignificantly different from zero. From a statistical standpoint, the data indicate that the average market surprise is equal to zero. This makes logical sense because a significant non-zero surprise would represent a contradiction. If a surprise is truly a surprise, then positives and negatives should balance out over time.
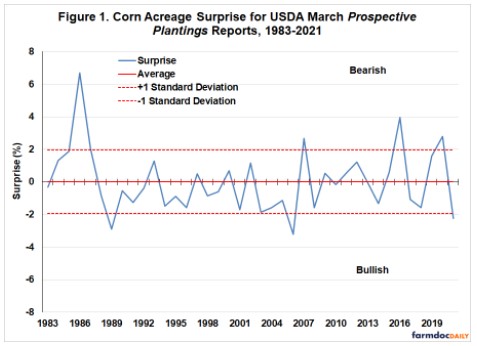
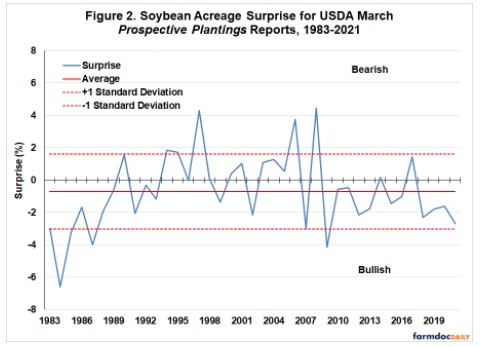
In order to get a sense of the volatility of acreage surprises over time, Figures 1 and 2 include plus/minus one standard deviation bands around the average. Since the standard deviation of surprises is similar for the two crops (2.0 percent for corn and 2.3 percent for soybeans), the one standard deviation bands are quite similar. In both cases, most of the surprises are between plus/minus two percent. These bands are helpful in assessing the magnitude of the 2021 planted acreage surprises for corn and soybeans. The 2021 surprise for corn of -2.2 percent is just outside the standard deviation band, while the 2021 surprise for soybeans of -2.7 percent is just inside the band. While both are large from a historical standpoint they are certainly not outliers. The 2021 surprise for corn is the third largest bullish surprise of the last 39 years and the surprise for soybeans is only the sixth largest bullish surprise.
The analysis so far is consistent with idea that the Prospective Plantings report was a bullish event for corn and soybeans this year. However, the level of the corn and soybean bullish surprises do not seem to line up with the explosive price moves following the release of the report. The first step in reconciling the corn and soybean acreage surprises and the price moves is found in Figure 3, which shows the relationship between the surprises for the two crops over 1983-2021. The chart is divided into four quadrants based on the market impact of the respective market surprises. The upper right quadrant contains observations where both corn and soybean surprises are positive/bearish, the lower left quadrant contains observations where both surprises are negative/bullish, and the other two quadrants contain opposite surprises. Most of the observations land in the two mixed quadrants, which makes sense because of the substitution relationship between corn and soybean planted acreage in much of the U.S. This is reflected in the negative slope of the estimate regression line between the corn and soybean planted acreage surprises. However, the overall relationship is not strong, with an R2 of only 0.19. In particular, there are a 10 observations in the lower left quadrant where both the corn and soybean acreage surprises are negative and bullish. It is noteworthy that 2021 is the most extreme example of both acreage surprises being bullish. This suggests that the key to understanding why prices reacted so strongly to the release of the Prospective Plantings report is the combined total of corn and soybean acreage, not necessarily the totals for each crop individually.
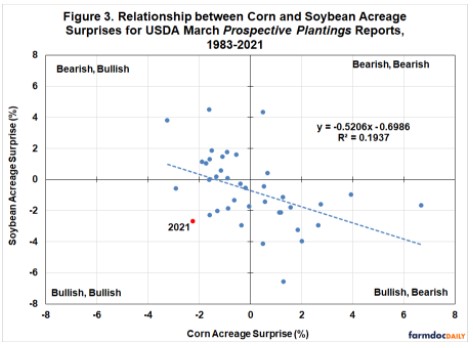
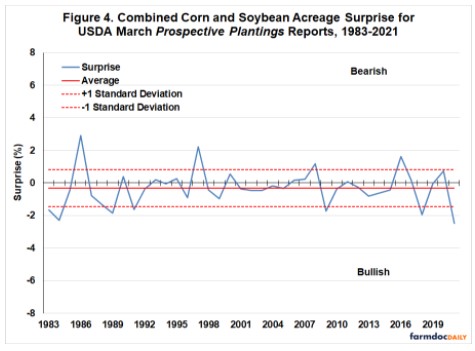
Figure 4 presents the combined acreage surprise for corn and soybeans over 1983-2021. This is computed by taking the difference between the combined market expectation for corn and soybean planted acreage and the combined USDA estimate (we don’t simply sum the two separate surprises). Once again the average for the combined surprise is near zero, but the one standard deviation band is narrower reflecting the offsetting tendency of corn and soybean acreage surprises. The combined surprise in 2021 is -2.5 percent and the largest bullish surprise of the last 39 years. The only comparable bullish surprise is -2.3 percent in 1984. Further perspective is provided in Figure 5, which shows the same combined surprises in acres rather than percent. The 2021 combined surprise is -4.5 million acres, and this is the largest bullish or bearish surprise of this type since 1983. This helps reconcile the huge upward move in corn and soybean prices after the Prospective Plantings report. The market reacted as much to the surprise in the combined total of corn and soybean planted acreage as the individual surprise for either crop.
Implications
Last week’s USDA Prospective Plantings report sent shockwaves through the corn and soybean markets. Futures prices for both crops did not take long after the report was released to move up the daily allow limit, a very unusual occurrence. In this article, we provide historical perspective on the magnitude of the corn and soybean acreage surprises contained in last week’s Prospective Plantings report. The analysis shows that corn and soybean acreage surprises for this year’s report are large from a historical standpoint, but they are certainly not outliers. The 2021 surprise for corn is the third largest bullish surprise of the last 39 years and the surprise for soybeans is only the sixth largest bullish surprise. The key to understanding the market reaction to the Prospective Plantings report is the combined estimates for corn and soybean acreage. The combined surprise in 2021 is -2.5 percent and the largest bullish surprise of the last 39 years. In acreage terms, the 2021 combined surprise is -4.5 million acres, the largest bullish or bearish surprise since 1983. This is what supercharged corn and soybean futures prices after the report.
A key issue moving forward is whether estimates of the combined total of corn and soybean planted acreage will increase in future USDA reports, the first of which is the June Acreage report. Future farmdoc daily articles will investigate whether historical patterns provide any clues as to the likelihood of this happening.