Figure 2 presents the opposite case where the mandated quantity, QM, is below the market equilibrium quantity, Q*. Since the competitive equilibrium results in more of the biofuel being consumed than the mandate requires, the mandate is non-binding in economic terms. The key implications of a non-binding mandate are: i) the RIN price is zero, and ii) the level of demand equals the market equilibrium quantity.
With that conceptual background, we can review the history of RIN prices for clues about the degree that RFS mandates have been binding historically. Figure 3 shows D4 biodiesel, D5 undifferentiated advanced, and D6 ethanol RIN prices from April 3, 2008 through May 25, 2023. Technically, D4 RINs are “biomass-based diesel” RINs that potentially represent a variety of biofuels, including FAME (fatty acid methyl ester) biodiesel, renewable diesel, and renewable heating oil. A common industry shorthand is to refer to D4 RINs as biodiesel RINs, and we follow that terminology here. Several observations are noteworthy. First, all three RIN prices generally have exceeded $0.50 per gallon, except for D6 prices before 2013 and a brief period during late 2017 through early 2020. This is clear evidence that the RFS mandate for each category of biofuels has been economically binding almost the entire time since 2013. Second, prices for all three RINs have been at or above $1.50 per gallon for most of 2022 and 2023, historically very high levels. This reinforces the previous point that the RFS mandates have been highly binding in recent years. Third, D5 and D6 RINs have generally tracked D4 RIN prices since 2013. This makes sense because biomass-based diesel has tended to be the “marginal” gallon for filling the biomass-based diesel, undifferentiated advanced, and conventional mandates for most of the history of the RFS (e.g., farmdoc daily, July 19, 2017).
The next step in the analysis is to define what we mean by a “RIN cliff.” To do that we will use the same economic model of D4 biodiesel RIN pricing that was presented in our previous farmdoc daily article of May 24, 2023. The analysis of the BBD market is keyed off FAME biodiesel because, as noted above, FAME has been the marginal (“last”) gallon for filling all but the cellulosic mandate. Even with the rise of renewable diesel production in recent years, FAME has maintained its position as the marginal gallon because renewable diesel production has not been large enough to fully meet RVO obligations. Additional details on the assumptions of the economic model can be found in our previous article.
Figure 4 presents an application of the model to D4 biodiesel RIN pricing. The D4 RIN price is the difference between the biodiesel price at the mandated quantity, PBD, and the biodiesel price at the tax credit quantity, P*BD, adjusted for the number of RINs produced per physical gallon of biodiesel (1.5). On May 4, 2023, the wholesale price of FAME biodiesel and ULSD in Chicago was $5.53 and $2.28 per gallon, respectively. The energy adjusted ULSD price was $2.11 = (0.927*$2.25) and the prediction of the pricing model is:
D4 RIN Price = $1.61 = [$5.53 – ($2.11 + $1)]/1.5.

On this same date, May 4, 2023, the traded market price for 2023 vintage D4 biodiesel RINs was $1.58 per gallon, quite close to the predicted value from the model.
Having established the utility of the pricing model, we apply it in Figure 5 to analyze what we call the “RIN cliff” scenario. The key is that production of BBD overshoots the mandated quantity for some exogenous reason, with the result that QRC > QM. The implications for biodiesel and RIN prices are dramatic. Since production exceeds the mandate, the market price of biodiesel is given by the intersection of demand with the tax credit and the RIN cliff quantity, QRC, which is the effective supply curve in this scenario. Consequently, the market equilibrium biodiesel price falls to $3.11 per gallon, $2.42 less than the market price when production is at the mandate level. To put this in perspective, the predicted biodiesel price drop is 44 percent. The most dramatic prediction is that the D4 biodiesel RIN price falls to zero, because no additional incentive beyond the market price of $3.11 is needed to incentivize BBD production. The D4 RIN price literally falls off a cliff. Basically, the BBD mandate becomes non-binding due to the exogenous overshooting of production.

There are two additional observations that should be made regarding the RIN cliff scenario outlined in Figure 5. First, the decline in RIN prices would not be limited to D4 biodiesel RINs. Because BBD plays the role of the marginal gallon for filling the advanced undifferentiated and conventional mandates, the price of D5 and D6 RINs would also fall off a cliff. It is not out of the question that all three RIN prices (D4, D5, and D6) in Figure 3 would fall all the way back to the pre-2013 level of D6 RINs. Second, the RIN cliff scenario is not a stable equilibrium due to the magnitude of financial losses that BBD producers would likely incur. The implications of significantly lower RIN prices for FAME biodiesel and renewable diesel prices would be profound for BBD producers. The potential for cutbacks in production and/or the shuttering of BBD plants to eliminate excess production and return to the mandated market equilibrium would be high. However, the duration and volatility of this adjustment process is hard to predict.
The question at this point is whether the RIN cliff is just an academic exercise or if there is a real possibility of the scenario happening. The proposed rulemaking for 2023, 2024, and 2025 RVOs by the Environmental Protection Agency (EPA), released last December, provides valuable information to help answer this question. We can use the proposed RVOs to estimate the maximum BBD needed to fulfill the RFS mandates for these three years. In essence, we can estimate QM in Figures 4 and 5.
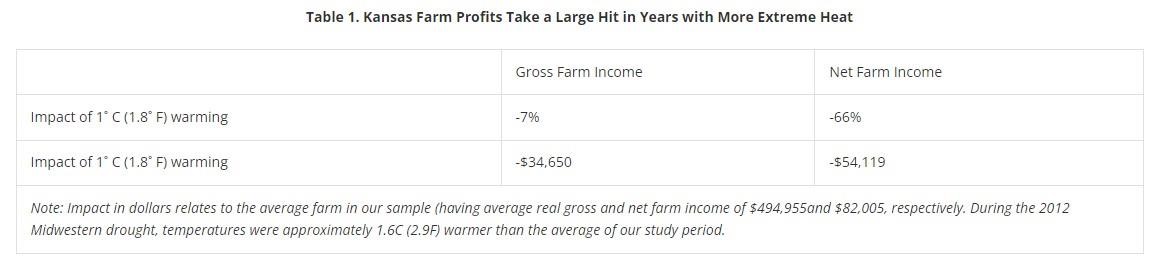
Panel A in Table 1 lists the RVOs proposed by the EPA for 2023, 2024, and 2025. Line 1 lists the total RVO across all mandate categories, which increases from 21.07 billion gallons in 2023 to 22.68 billion gallons in 2025. Line 2 lists the RVOs for the advanced mandate, which is made up of the cellulosic (line 3), BBD (line 4), and undifferentiated (line 5) mandates. The BBD RVO is reported by the EPA in physical gallons, which are converted to RIN gallons in Table 1 by multiplying by 1.5. The conventional RVO is shown on line 6, and it is the difference between the total and advanced RVOs. It is a constant 15.25 billion gallons each year.
Panel B in Table 1 provides estimates of the maximum number of BBD gallons needed to comply with the proposed RVOs. The estimates are maximums because there are small amounts of other biofuels (e.g., sugarcane ethanol from Brazil) that are also typically used to comply with RVOs, and to the degree these other biofuels are used for compliance this will reduce the amount of BBD needed for compliance. The amounts usually are no more than a couple of hundred million gallons, but this should be kept in mind when considering the estimates in Table 1. In addition, the estimates in Panel B are computed in wet physical gallons to facilitate comparisons with physical production.
Line 6 in Panel B of Table 1 estimates the amount of BBD needed to comply with the BBD RVO by dividing the BBD RVO in Panel A by 1.6. This reflects a simplifying assumption that half of BBD will be FAME biodiesel, with a RIN equivalence value of 1.5, and half will be renewable diesel, with a RIN equivalence of 1.7. This assumption may result in a slight overestimation of BBD physical gallons given that recent production levels show renewable diesel production outpacing FAME production. A similar calculation for line 7 yields the maximum amount of BBD needed to comply with the undifferentiated RVO. Line 8 shows our estimates of the maximum amount of BBD needed to comply with the conventional RVO. We assume that domestic ethanol consumption in the form of E10, E15, and E85 will be 14 billion gallons each year. This is subtracted from the conventional RVO in Panel A, and the difference is divided by 1.6 to estimate BBD needed to fill the conventional RVO.
The key for our purposes is line 9 in Panel B of Table 1, which is the total BBD needed for compliance with the proposed RVOs. The estimated maximum total is very close to four billion (physical) gallons of BBD each year. If the proposed RVOs for 2023, 2024, and 2025 are finalized, this is the maximum amount of BBD that can be supplied in the U.S. market (domestic and imports) without going off the RIN cliff. In other words, the maximum demand for BBD in the U.S. is set by the RVOs, and this equals about four billion gallons per year.
We analyze a second RVO scenario in Table 2. In the preliminary rulemaking, the EPA proposed creating a new “eRIN” pathway for generating cellulosic RINs. This pathway would allow electric vehicle (EV) manufacturers to generate RINs based on EV sales and estimated EV miles driven. The proposal was highly controversial, and recent press reports indicate it may be dropped in the final rulemaking (Kelly and Renshaw, 2023). In Table 2, we assume that the cellulosic RVO allocated to eRIN generation in 2024 and 2025 is transferred to the undifferentiated advanced mandate. This is the only change compared to the policy scenario in Table 1, as the overall total, total advanced, BBD, and conventional mandates are unaffected. Under this assumption the estimated maximum BBD needed for compliance increases to 4.41 billion gallons in 2024 and 4.85 billion gallons in 2025.
The estimates in Tables 1 and 2 provide half the information needed to assess whether a RIN cliff is looming for the RFS. The other half is the physical supply of BBD into the U.S. market. Figure 6 presents this information in the form of monthly (annualized) D4 RIN generation over January 2021 through April 2023. We use D4 RIN generation to represent BBD supply for two reasons. First, RIN generation reflects both domestic production and imports. Second, more recent data is available for RIN generation compared to physical production and imports. Annualized D4 RIN generation has steadily increased over this period, from about 2.5 to 4.5 billion (physical) gallons, consistent with the ongoing boom in renewable diesel production. The trend rate of growth in annualized D4 RIN generation is about 60 million gallons per month.
The red-shaded area in Figure 6 represents the range of RIN cliff estimates under the RVO scenarios in Tables 1 and 2. It is very interesting to observe that D4 RIN production has been near or even exceeded the lower bound of this range since November 2022. It is, therefore, not surprising that there has been such a concerted lobbying effort to eliminate the eRIN program from the final rulemaking and transfer the eRIN gallons to the undifferentiated mandate. What is striking is how close recent D4 RIN generation has been to the upper bound of the estimated RIN cliff range. Both March and April 2023 have been above 4.5 billion gallons (annualized), only 500 million gallons from the top of the RIN cliff range. If present trends persist in D4 RIN generation, annualized generation will reach five billion gallons in a little under a year.
Even larger levels of D4 RIN generation are possible if one considers current plans to expand renewable diesel plant capacity. Figure 7 shows actual renewable diesel nameplate production capacity in the U.S. for 2010 through 2022 and projected capacity for 2023 through 2025 and later. This figure was originally presented in a farmdoc daily article from March 29, 2023. See that article for details on the construction of the capacity estimates. Renewable diesel production capacity is expected to rise to 5.5 billion gallons in 2024, 6.0 billion gallons in 2025, and 7.4 billion gallons at some point after 2025. If all of this capacity is utilized, renewable diesel production alone would be greater than the upper bound estimate for the RIN cliff (see Figure 6) as soon as 2024.
The potential for the RFS going over a RIN cliff in the next few years is real but not a given. A complicated set of factors will determine whether this in fact happens. On the demand side, the level and composition of the RVOs in the final EPA rulemaking for 2023, 2024, and 2025 will have a major impact. On the supply side, several factors will be important, including: i) expansion of renewable diesel production capacity, ii) declines in FAME biodiesel capacity, iii) plant utilization rates for both renewable diesel and FAME biodiesel, and iv) the level of BBD imports.
Implications
The scale of the renewable diesel boom has been so large that it has raised unusual questions about the U.S. Renewable Fuel Standard (RFS). There is a real possibility that the total supply of biomass-based diesel (BBD) will exceed the RFS mandate for BBD by a considerable margin. Since the BBD mandate is binding, the mandate sets the maximum extent of BBD demand. When this condition is violated, our analysis indicates that the consequences for BBD and RIN prices would be dramatic. The D4 biodiesel RIN price is predicted to fall to zero because no additional incentive beyond the competitive market price is needed to incentivize BBD production. Literally, the D4 RIN price falls off a cliff. Because BBD also plays the role of the marginal (“last”) gallon for filling other components of the RFS mandates, the fallout of production overshooting would not be limited to D4 biodiesel RINs. In sum, it appears that something has to give to avoid the RFS going over a RIN cliff, especially in light of current projections for expansion of renewable diesel production capacity. Either RFS mandates going forward have to be increased substantially to accommodate the boom in renewable diesel production, or the supply of BBD will have to be reduced somewhere else.
Disclaimer: The findings and conclusions in this publication are those of the authors and should not be construed to represent any official USDA or U.S. Government determination or policy. This work was supported in part by the U.S. Department of Agriculture, Economic Research Service.
Source : illinois.edu