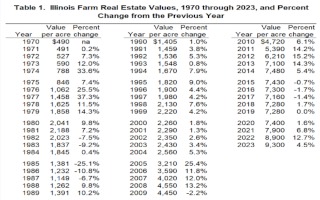
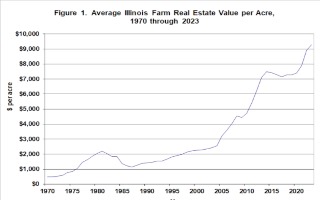
Since 1970, average farm real estate values have declined only six times as compared to the previous year. Those years were 1982, 1983, 1985, 1986, 1987, 2009, 2015, 2016 and 2017. There have been four years when farm real estate values increased over 20 percent, in 1974, 1976, 1977 and 2005. The largest increase was in 1977 when values rose 37.3 percent.
From 1995 through 1999, average farm real estate values increased between 4.2% and 9% annually. From 2000 to 2004, farm real estate increased between 1.3% and 5.3%. From 2005 to 2009 the change in average farm real estate values ranged from -2.2% to 25.4%. From 2010 to 2014, the increase in farm real estate values ranged from 5.4% to 15.2%. From 2015 to 2020, the change in farm real estate values have not varied much with a range from -1.7% to 1.7%. Since 2020, the percent increase has averaged 8% with 2022 having the highest increase for 12.7% during this period.
With interest rates increasing at the end of 2022 and into 2023, some of the lower percentage of increase in land values for 2023 can be explained even with higher net farm incomes in 2022 and projected farm incomes for 2023. The higher interest rates have led to other investment opportunities for farmers and investors.
The farm real estate value data is used to construct index numbers of Illinois farmland values. The index can be found at the farmdoc website here. This index can be used to estimate a current or past value using purchase price or appraisal. In addition to this index, excel tools that do the calculation for you can be found here. In addition, you can use a cropland index tool there as well.
Source : illinois.edu