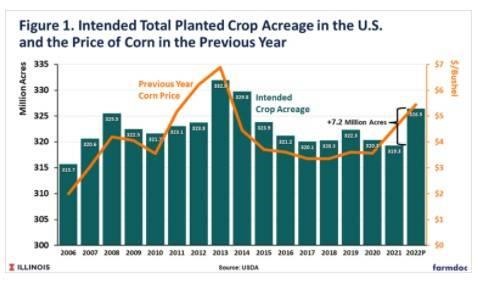
Total intended crop acreage increased during the ethanol boom years from 2006 through 2013, peaking at 332 million acres in 2013. After this peak, acreage declined steadily to a low of 319.3 million in 2021. While there are a variety of factors that influence the level of total crop acreage, the data indicate that economic incentives play an important role. A simple measure of that incentive is the marketing year average price of corn. While simple, corn does have the largest share of crop acreage in the U.S. Here, we plot the total intended crop acreage vs. the marketing year price of corn lagged by one year in order to reflect the market price in the time frame when farmers made acreage decisions for a given crop.
There is clearly a relationship between current total crop acreage and the previous year price of corn. It is not exact by any means, but is helpful in predicting trends in total acreage. The WASDE forecast for the season average price of corn for 2021/22 was $5.45 per bushel at the time of this writing. This is the price that is relevant for projecting total acreage for 2022. Since the price of corn is so high, historically speaking, it suggests a sharp rebound in total crop acreage of around 7 million acres. This would put total acreage at 326.5 million in 2022, the highest level since 2014.
The projection of a jump in total intended crop acreage for 2022 is a crucial part of projecting corn and soybean planted acreage. Prices for most crops are currently high from a historical standpoint, so there is an incentive to plant more of many crops. The projected increase in Figure 1 means that planted acreage can basically increase across the board and crops will not have to “steal” acres from other crops in order to expand acreage.
With that context, we can move on to projecting corn and soybean planted acreage for 2022. The steps involved are shown in Table 1. The starting point here is the combined total of corn and soybean acreage, which has not varied much in recent years. This makes sense because corn and soybeans generally “compete” for the same acres and the total of the two crops does not vary greatly from year-to-year. We do forecast a small increase in combined corn and soybean acreage for 2022, in view of the increase in total crop acreage availability and high prices for both crops. Our projection is 183 million acres, the highest in recent years. We project 1.5 million prevented plant acres in 2022 for the two crops, near the historical average, and this results in 181.5 million combined planted acres for the two crops.
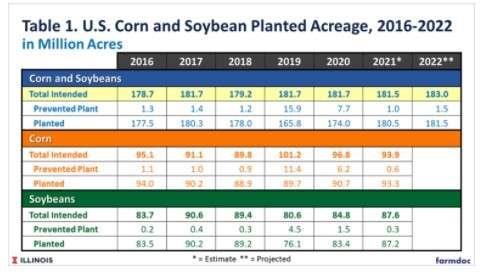
The split between corn and soybeans for the 181.5 million acre forecast is a key source of uncertainty. As noted earlier, rising input costs add to this uncertainty for 2022. The relationship between the new crop soybean/corn futures price ratio and the percentage of soybean planted acreage has provided helpful signals in the past. At the time of this writing (early December 2021) the new crop price ratio was around 2.25, a level that favors corn and predicts a very low percentage of soybean acres. We take a conservative approach in view of the rise in input costs and project soybean acreage at 47 percent of combined corn and soybean acres. This results in forecasts of 97 million intended acres of corn and 86 million intended acres of soybeans. After adjusting for projected prevented plant acres, our final forecasts of corn and soybean planted acreage are 96.0 and 85.5 million acres, respectively, for 2022.
These acreage forecasts are not hugely different from actual planted acreage for corn and soybeans in 2021. However, the corn acreage forecast is well-above the forecasts of most other analysts at the present time. It is frequently argued that input cost increases, particularly for nitrogen fertilizer, dampen the incentives to expand corn acreage in 2022. Time will tell if this truly comes to pass.
Source : illinois.edu