and Brenna Ellison
Department of Agricultural Economics
Purdue University
The Gardner Food and Agricultural Policy Survey is conducted quarterly to track perceptions of the food system and to react quickly to relevant food and agricultural issues. In this post, we unpack how consumers’ perceptions of the food system – in particular, affordability – have changed in the last fifteen months. Given the focus on affordability, we also look at how consumers say inflation is impacting them and their expectations about inflation going forward.
How We Measure Perceptions of the Food System
Data for each wave is collected via online survey using Qualtrics Panels. About 1,000 participants are recruited each wave to match the US population in terms of gender, age, US census region, and annual household income. Results now allow us to follow change in public opinion of food issues from May 2022 (wave 1) to August 2023 (wave 6).
To measure perceptions, participants in each wave were asked to what extent they agreed or disagreed with seven statements about the food system:
- Our food system produces food in a sustainable manner.
- Our food system produces food that is safe to eat.
- Our food system produces food that is tasty.
- Our food system produces food that is healthy.
- Our food system produces food that is affordable.
- Our food system produces food that is accessible.
- Our food system produces food in a manner that provides healthy returns for supply chain actors (farmers, food manufacturers, grocery stores, etc.)
The order of the statements was randomized to prevent ordering effects. For each statement, participants could indicate they strongly agreed, somewhat agreed, neither agreed nor disagreed, somewhat disagreed, or strongly disagreed. For comparison across waves, we evaluate the percent of each wave’s sample that agreed (strongly or somewhat) with each statement.
Results: How Perceptions of the Food System Have Changed
Across all six waves, we find that participants’ perceptions of the food system were generally positive. Table 1 shows the percent of participants across waves that agreed with each statement in each wave. We find that in most waves, the majority of participants thought the food system produced food that was safe, tasty, healthy, affordable, and accessible. Similarly, across all waves, over 50% of participants thought the food system produced food in a sustainable manner and in a manner that provided healthy returns for supply chain actors. Overall, participants had the highest level of agreement that our food system produces tasty food and the lowest agreement that our food system produces affordable food.
Some of these perceptions have varied across time. In Table 1 we show the percentage of participants in each wave that agree with each statement. Perceptions of taste, sustainability, and accessibility have changed little across the six waves. Perception of both healthfulness and safety declined in the most recent wave (August 2023). The declines in the perception of healthfulness and safety do not seem to be related to a major food recall (e.g., see FDA list of major food product recalls). The perception of healthy returns for supply chain actors also declined in the most recent wave, which may be related to general pessimism regarding inflation.
Table 1. Percent of Participants in Each Wave that Agree the Food System Produces Food …
Perception of affordability changed the most across waves, which is in line with the pressure of rising food prices. Food prices have risen for a variety of reasons, including supply-chain issues, increased costs of energy and transportation, increased cost of some basic food ingredients (e.g., eggs, oil) from disease outbreaks, extreme weather events, trade restrictions, and increased demand for food (see Nelson, E; Swanson, A; and Smialek, J; 2023; Patton, M; Westhoff, P; etc.). Some also blame higher profit margins (see Simonetti, I and Creswell, J. 2023; Popli, N. 2023). In a previous report, we discussed public perception of what is to blame for inflation – and most participants blamed government policy and impacts from the Covid-19 pandemic (farmdoc daily, September 1, 2022).
Although food price inflation has slowed in recent months, consumers are still paying much higher prices at the grocery store than they were in recent memory. The Bureau of Labor Statistics’ Consumer Price Index’s July 2023 report shows that prices for food are up 4.9% from July 2022. August numbers are set to be released this week (Wednesday, September 13, 2023).
Figure 1. Percent of Participants who Agree the Food System Produces Food that is Affordable (Across Waves)
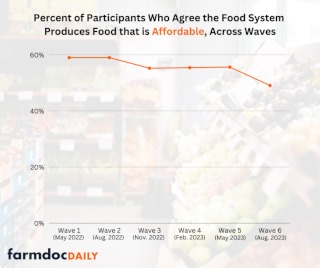
Figure 1 shows how the perception of affordability varied across the six waves graphically. A little over a year ago – in both wave 1 (May 2022) and wave 2 (August 2022) – nearly 60% of participants agreed the food system produces affordable food. But as food price inflation rose, perception of affordability dropped. This wave (August 2023) was the first time we found that only 49% of participants agreed the food system produces food that is affordable. Our results indicate that most participants no longer agree that the food system produces food that is affordable.
Results: More on Inflation and Affordability
As inflation continued to affect consumers, we added relevant questions to the survey waves. In previous posts, we discussed how consumers were responding to food price inflation by adjusting behavior at the grocery store (farmdoc daily, August 25, 2022 and January 19, 2023) and how they were changing up their meal plans for winter holidays (farmdoc daily, December 22, 2022).
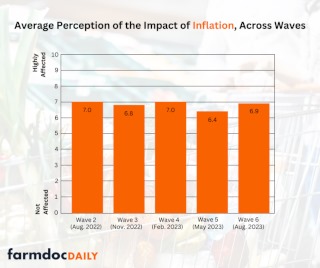
In wave 2 (August 2022) we began asking participants about the extent to which they felt inflation affected them in the last month (on a scale from 0, not affected, to 10, highly affected). Over the last year, the average rating has continued to show consumers feel affected by inflation – with average ratings hovering between 6.4 and 7.0 (see Figure 2).
Figure 2. Average Perception of the Impact of Inflation (Waves 2 to 6)
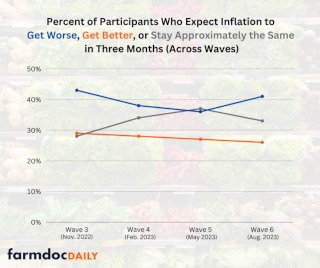
In wave 3 (November 2022), we began to ask whether participants expected inflation to get worse, better, or stay the same by the next wave (three months later). Figure 4 shows the percentage of participants in each wave that indicated they expected inflation to improve, worsen, or stay approximately the same.
Over the past few waves, expectations for inflation seemed to be leveling off – with continued increases in the percent of participants who indicated they thought inflation would be approximately the same in three months. However, in the most recent wave, conducted in August 2023, we find that consumers became more pessimistic – with fewer participants believing inflation would level off and more consumers believing inflation would get worse.
Figure 3. Percent of Participants who Expect Inflation to get worse, better, or stay approximately the same in three months (Waves 3 to 6)
Results from the Federal Reserve Bank of New York’s Survey of Consumer Expectations in July 2023, indicates that people were expecting inflation to continue to slow and they were more optimistic about the rate of inflation than they were a year ago. Updated results from the survey for August 2023 are expected to be released today (Monday, September 11, 2023).
Conclusion
It is important to continue to evaluate consumer perceptions of the food system, as the results have important implications for consumer demand at the grocery store and for policymakers. Here, we focus on how the perception of affordability has changed across the last 15 months. We find that the perception of affordability continues to decline, and for the first time we find that a bare majority of participants do not agree that our food system produces affordable food. Additionally, we highlight changes in experiences with and expectations for inflation.
The Gardner Food and Agricultural Policy Survey has continued tracked perceptions of food system for the past six quarters and has responded quickly to relevant topics as they have arisen in the food system. In the coming weeks, we will be discussing additional results from this survey, focusing on consumer perceptions of extreme weather events and its impact on the food system and unpacking how consumers’ priorities for farm bill spending have evolved over time.
Source : illinois.edu