One way to examine price seasonality is to estimate a seasonal price index. Most seasonal price indices are monthly indices. Each value in the price index gives the relationship between average prices for a specified month compared to the annual price average. The index value for a specific month is the percentage deviation in that month’s average price from the annual average price. For example, an index value of 106 in August means that August prices average 106-100=6 percent higher than the annual average price. Similarly, an index value of 98 in December means that December prices average 98 percent of the annual average price or 98-100=2 percent below the annual average.
Figures 1 and 2 plot the 10-year average price index (red line) for 500-600 lb. and 700-800 lb. Arkansas steers. The dotted blue lines in each figure provide a statistical range that we would expect the average price index to fall within 68 percent of the time. Blue lines that are farther apart means that there is more variability in our estimated price index.
Figure 1 depicts a clear seasonal pattern for 500-600 lb. steers. Prices average 6 percent above the annual average in March and remain above the annual average through May before declining during the summer months. Prices are seasonally at their lowest in September, 94.6 percent of the annual average. The seasonal pattern in Figure 1 is consistent with prices declining during the fall calf market due to a large supply of calves.
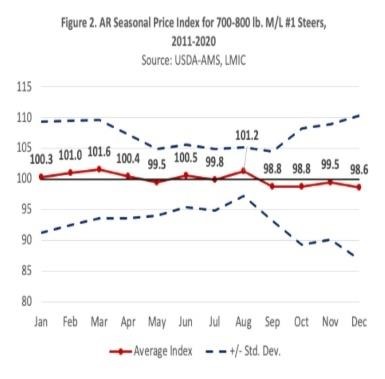
Heavier feeder cattle have a more subtle seasonal pattern (Figure 2). In Arkansas, feeder steer prices follow the annual average price more closely. Prices for 700-800 lb. steers are seasonally high during the March (101.6) and August (101.2) feeder cattle markets. Arkansas feeder cattle prices are seasonally lowest in December (98.6).
Source : osu.edu