Discussion
The current base acreage system traces its origins to the Food Security Act of 1985 (P.L. 99-198). Section 1031 of the 1985 Farm Bill established the acreage base and yield system for wheat, feed grain, upland cotton, and rice program by adding a Title V to the Agricultural Act of 1949. The system was applicable to the 1986 through 1990 crops, and Congress instructed USDA to direct the county committees to determine farm acreage bases. These acreage bases were to be calculated as “the number of acres that is equal to the average of the acreage planted and considered planted to each program crop for harvest on the farm in each of the five crop years preceding such crop year” (P.L. 99-198, at Sec. 1031).
Section 1101 of the Food, Agriculture, Conservation, and Trade Act of 1990 amended the acreage base and yield system established in the 1985 Farm Bill, calculating the acreage base as the “number of acres equal to the average of the acreage planted or considered planted to the program crop for harvest on the farm in each of the 5 crop years preceding the crop year” (P.L. 101-624, at Sec. 1101). For cotton and rice, Congress provided an alternative calculation that used the average acres planted or considered planted “in each of the 3 crop years preceding such crop year” with exceptions in each of the 1991 and 1992 crop years “if the producers on a farm did not participate in the production adjustment program” in the years preceding those crop years, which shifted the calculation to the five-year average as for all other crops. The 1985 and 1990 base acre calculations were coupled to the planting decisions of farmers because acres planted determined the acres that would receive payments, albeit on a 3- or 5-year average basis.
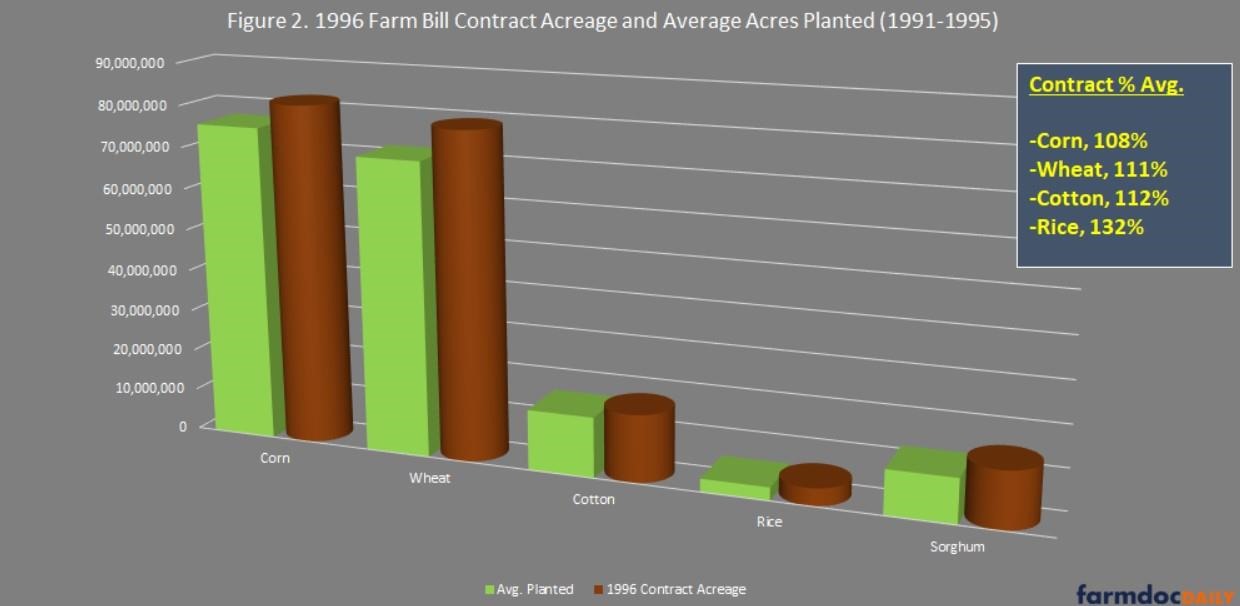
The Federal Agricultural Improvement and Reform Act of 1996 decoupled payments from planting and production decisions by establishing contract acres as “1 or more crop acreage bases established for contract commodities” calculated as those “that would have been in effect for the 1996 crop year” (7 U.S.C. §7202(4); P.L. 104-127). Rather than connecting payments to a rolling average of the previous years’ planting decisions, Congress in the 1996 Farm Bill fixed the acres going forward based on what would have been in place that year, which were the average of the acres planted in the five years preceding that crop year (i.e., 1991-1995). Figure 2 compares the 1996 contract acreage with the average acres planted to each of the cover commodities from 1991 to 1995. Average planted acres were calculated using NASS Quickstats database (https://quickstats.nass.usda.gov/) and the 1996 contract acres were reported by USDA’s Economic Research Service (ERS, September 2005).
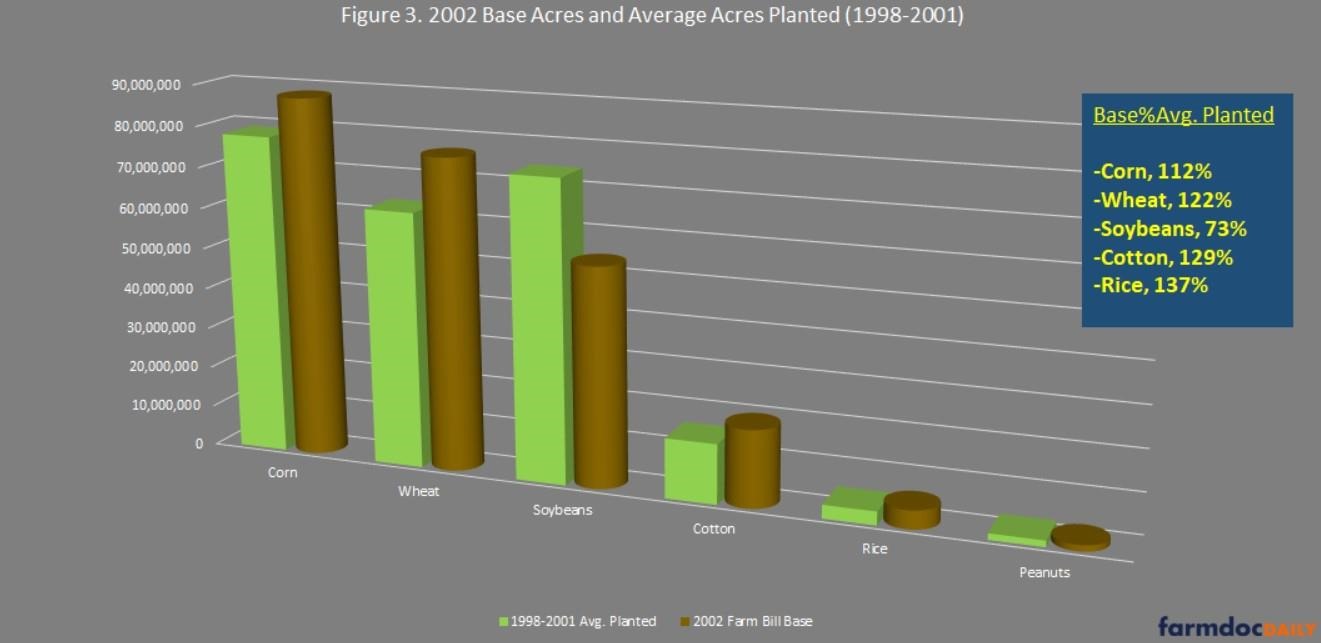
The Farm Security and Rural Investment Act of 2002 reverted to the term base acres and permitted farm owners the opportunity to update their base acres in large part to add soybeans and other oilseeds to the programs. Congress provided farm owners a one-time opportunity to elect the calculation method (P.L. 107-171; 7 U.S.C. §7911). First, a farm could add oilseeds by a complete update of base acres using the 4-year average of the acres planted (or prevented from being planted by natural causes; double cropping could also be used) in the crop years 1998 through 2001. Second, the farm could keep 1996 contract acres without changes. Third, a farm could add oilseeds to the 1996 contract acres, up to the base acre maximum for the farm (i.e., adding only a portion of the acres planted to oilseeds). Fourth, a farm could add oilseeds to the 1996 contract acres, but offset the additional oilseed planted acres by proportionally reducing 1996 contract acreage or otherwise reduce the additional acres to stay within the farm’s maximum (ERS, September 2005). Incorporating oilseed acreage on the farm from 1998 through 2001 added soybeans to the payment programs which were, at that time, direct payments and counter-cyclical payments (DCP or DP and CCP). Figure 3 compares the 2002 Farm Bill base acres as reported by ERS with the average planted acres reported by NASS Quickstats.
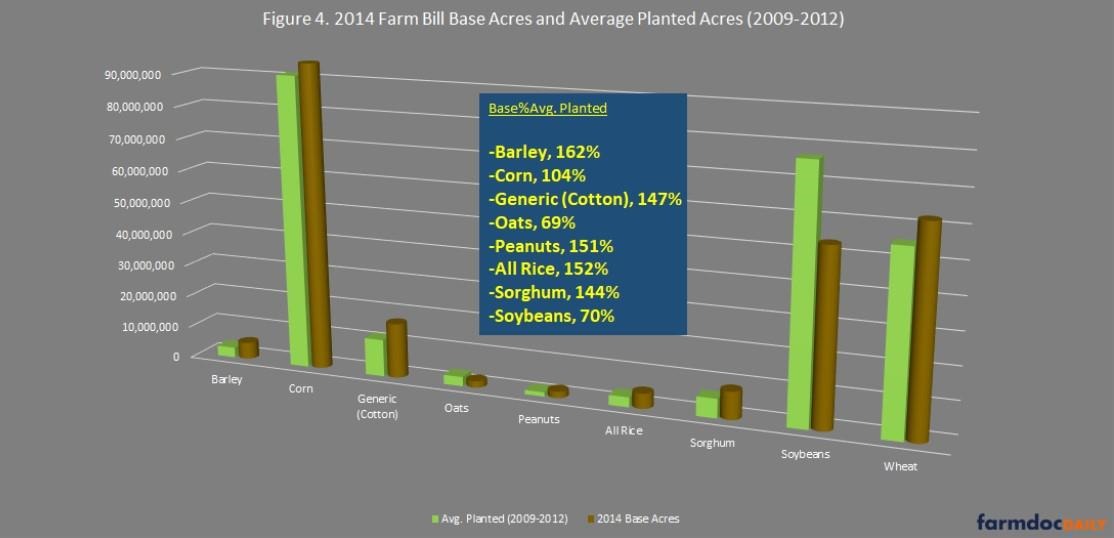
The base acres updated in 2002 were continued by the Food, Conservation, and Energy Act of 2008 (P.L. 110-246; 7 U.S.C. §8702(2)). In the Agricultural Act of 2014, Congress established reauthorized the 2008 Farm Bill base acre provisions, defined as those in effect on September 30, 2013 (P.L. 113-79; 7 U.S.C. §9011(4)). Congress did, however, authorize a one-time opportunity for owners of the farm to reallocate base acres. If the farm owner elected to reallocate, the calculation was determined by the four-year average of the acreage planted or prevented from being planted in crop years 2009 to 2012 (see e.g., farmdoc daily, March 6, 2014; July 24, 2014; September 26, 2022). Reallocation, however, was not to permit a farm to increase base acres but simply better align existing base with recent planting decisions. permitted farm owners a one-time opportunity to retain or reallocate their base acres and the. Also in 2014, Congress removed upland cotton from the farm payment programs in response to having lost and settled the World Trade Organization dispute with Brazil. Former upland cotton base acres were converted to generic base and could only receive payments if attributed to another covered commodity (see e.g., farmdoc daily, April 13, 2017; April 20, 2017; May 18, 2017). Figure 4 compares the base acres under the 2014 Farm Bill with the average acres planted in 2009 to 2012 as reported by NASS Quickstats.
The Agricultural Improvement Act of 2018 continued the base acres as determined in 2014, with one exception (P.L. 115-334). Prior to reauthorizing the farm bill, Congress created a new covered commodity called “seed cotton” that permitted cotton farmers to return acreage to the payment programs (see e.g., farmdoc daily, February 14, 2018). With that restoration of cotton, the current base acreage system has largely been in place since 2014. Figure 5 provides an overview of the current base acres for the major program crops. The interactive map displays the 2019 to 2023 average of each state’s total base acres as reported by FSA (USDA FSA, ARC/PLC Program Data). Hovering over each state will display the total average base acres for the state, as well as that state’s share of the national total and the share of the state’s total base acres for each of the major program crops. Only three states have more than 20 million total base acres (average 2019 to 2023): Iowa (21.5 million; 9.04%), Kansas (20.9 million; 8.75%), and Illinois (20.2 million; 8.47%).
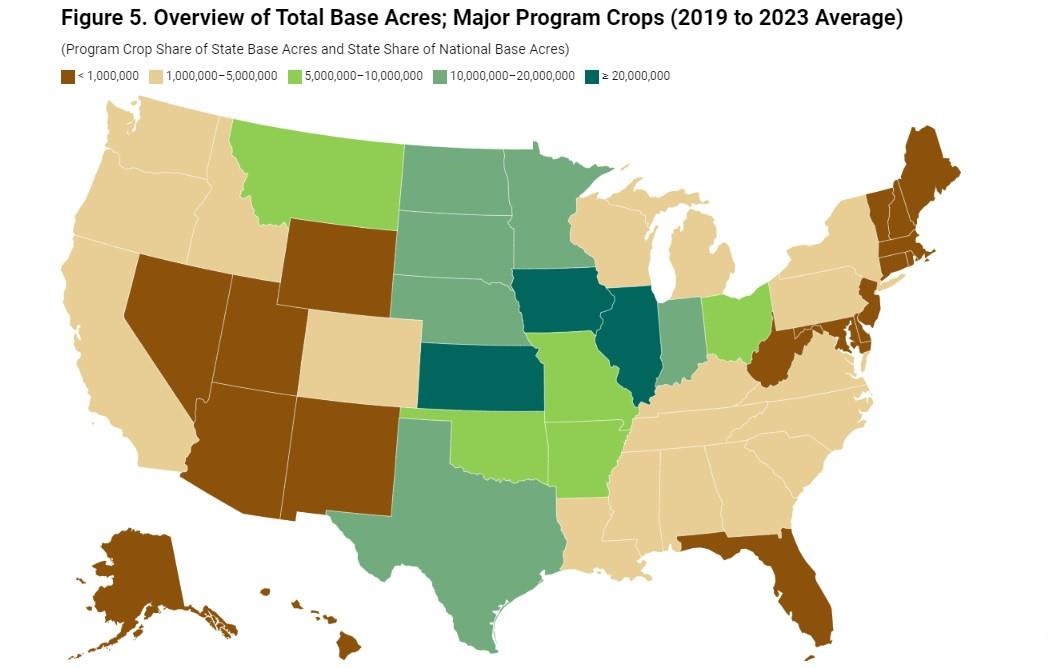
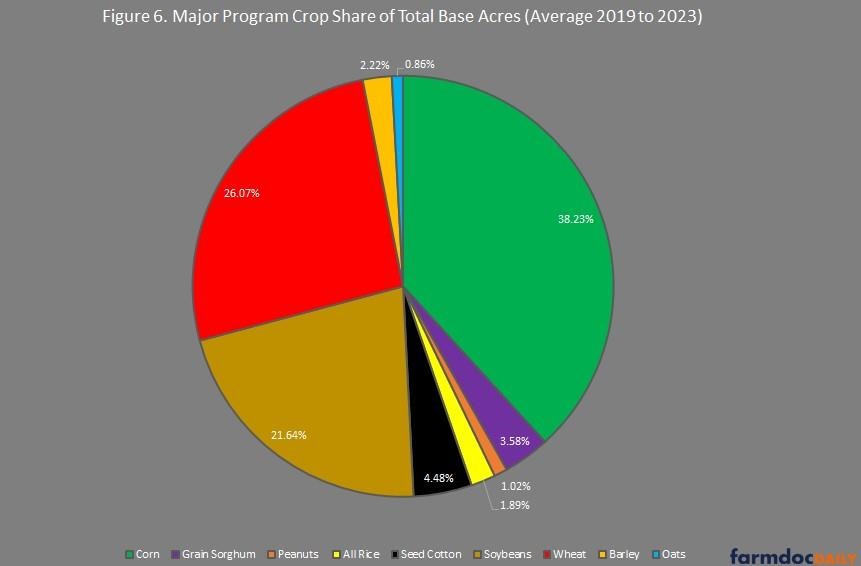
Figure 6 completes this discussion by illustrating each of the major program crop’s share of the total average base acres for those crops from 2019 to 2023. The total base acres for these crops, which constitute more than 95% of all base acres, averaged 238.3 million over 2019 to 2023. Additionally, not shown in Figure 6, is that 55.7% of these base acres were enrolled, on average, in PLC while 44.4% were enrolled in ARC.
Concluding Thoughts
The modern system of decoupled base acres for making farm program payments may seem an odd or even problematic policy design. It is possible for farmers to receive payments for crops they did not plant or harvest, and farmers who plant the same crops can receive very different payments depending on the base acres associated with the farm. Decoupled base acres provided the most substantial reform in the 1996 Farm Bill because the policy addressed one of the most enduring puzzles for farm policy. Up to that point, federal support for program crops had been plagued by the problem that the federal assistance incentivized planting. Moreover, it provided the most incentive when prices were the lowest and crops oversupplied, which only contributed further to the supply and price problems. For example, the parity system that emerged out of the New Deal era attempted to use acreage allotments to address the production incentive of the federal support, which often resulted in federally mandated reductions in plantings of supported crops. That policy failed miserably. Beginning in 1973, farm policy prioritized direct income supporting payments triggered by target prices and directly coupled to the acres planted that were explicitly designed as production incentives; under the policy and with other encouragement from export markets to Secretary of Agriculture Earl Butz, farmers drastically increased acres planted (see e.g., farmdoc daily, April 9, 2020; May 30, 2019; July 11, 2019). During the twin farm economic and soil erosion crises that followed, Congress began to shift away from that policy using multi-year averages of planted acres, recreating the Conservation Reserve Program and establishing conservation compliance for payments. Base acres may present myriad problems, but history teaches that the alternatives could be much worse or more problematic.
Source : illinois.edu