The stark reality of "business as usual" is not going to work if dairy operations are to survive. Strategies to improve animal performance and evaluate rations for all animal groups needs to be an ongoing practice. The bar must be set higher and higher if an operation wants to maintain a competitive cost of production. It still comes down to knowing your numbers and making decisions on fact, not fiction.
Table 1. Dairy Sense milk and feed prices for 2017 through 2021 with the same average milk production/year.1
| Year | Milk Price per cwt | Milk Income per cow | Total milk income per year | 210 milk cows feed cost/year | 45 dry cows
feed cost/year | 230 heifers feed cost/year | Total Feed Costs | Total milk income minus total feed costs |
|---|
| 2021 | $19.11 | $15.86 | $1,215,769 | $572,576 | $55,845 | $142,032 | $770,453 | $445,316 |
| 2020 | $17.93 | $14.88 | $1,140,698 | $516,621 | $60,608 | $146,073 | $723,302 | $417,395 |
| 2019 | $18.79 | $15.60 | $1,195,410 | $473,697 | $53,546 | $130,962 | $658,205 | $537,206 |
| 2018 | $17.13 | $14.22 | $1,089,802 | $416,210 | $45,497 | $115,012 | $576,718 | $513,084 |
| 2017 | $18.26 | $15.16 | $1,161,692 | $421,575 | $45,497 | $113,333 | $580,405 | $581,287 |
1Cow numbers reflect a herd milking 210 cows with an average milk production of 83 pounds milking 2x.
Note: The 2021 milk price was estimated from the futures markets for December. Total feed costs include expenses associated with home-raised and purchased feeds.
Economic perspective
Monitoring must include an economic component to determine if a management strategy is working or not. For the lactating cows, income over feed cost is a good way to check that feed costs are in line for the level of milk production. Starting with July 2014's milk price, income over feed cost was calculated using average intake and production for the last six years from the Penn State dairy herd. The ration contained 63% forage consisting of corn silage, haylage, and hay. The concentrate portion included corn grain, candy meal, sugar, canola meal, roasted soybeans, Optigen, and a mineral vitamin mix. All market prices were used.
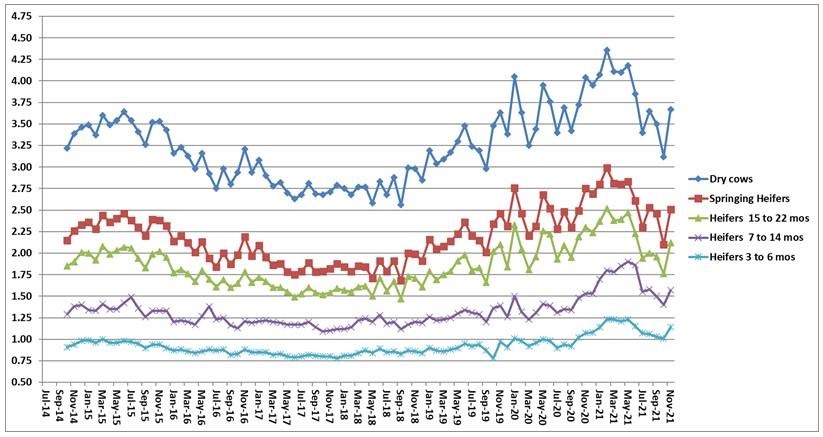
Also included are the feed costs for dry cows, springing heifers, pregnant heifers, and growing heifers. The rations reflect what has been fed to these animal groups at the Penn State dairy herd. All market prices were used.
Income over feed cost using standardized rations and production data from the Penn State dairy herd.
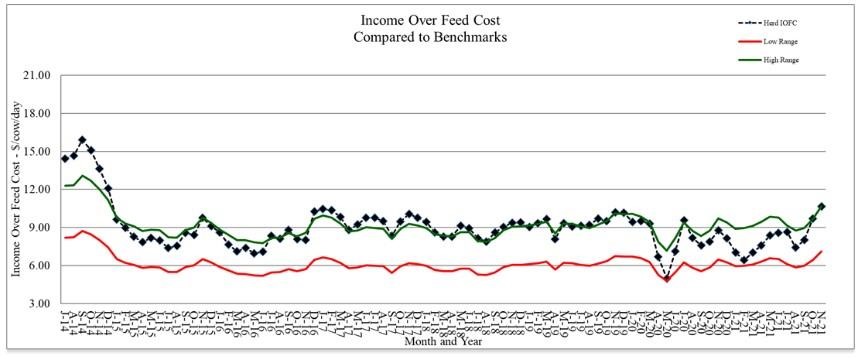
Note: November's Penn State milk price: $21.43/cwt; feed cost/cow: $7.13; average milk production: 83 lbs.
Feed cost/non-lactating animal/day.
Source : psu.edu