Yields are the main metric driving profitability in the cropping enterprise. They can be derailed by drought and the unavailability of inputs, such as fertilizer. If fertilizer and chemicals are available, how will their increased price impact cost per unit? Knowing the farm's costs could define the turning point when the negatives outweigh the positives.
The Extension dairy business management team has been summarizing the cropping enterprise on dairy operations for many years. Using the 2020 crop summary report, various inflation rates were examined for forages and grains. Table 1 shows corn silage and small grain silage costs per acre and per ton based on yields. There has been a declining trend in market prices for forages. The average this year has corn silage at $46/ton and small grain silage at $67/ton. The operations at the highest risk of producing forages more expensively than what the market is offering are the low yielding and very high input cost farms. Currently, there is not a lot that can be changed regarding small grain silage, however, if a farm is consistently achieving low yields, then there is opportunity to revisit the cropping program. With planting season around the corner, there are opportunities to assess strategies for corn silage.
Corn grain and soybeans are commonly grown in Pennsylvania as a cash crop or to supplement feed on the dairy. Table 2 illustrates the effect of yield and inflation rate on costs. Currently, the futures for corn are approximately $7.50/bushel and for soybeans $16.00/bushel. If these prices persist, then farms that average close to the low yields reported in Table 2, can still make some profit. However, the commodity markets are a moving target and could easily change based on global events or weather.
Decisions made on the cropping enterprise have a ripple effect on the dairy enterprise. Home-raised feed costs are a major contributor to the total feed costs. Poor yields affect inventories available to feed the herd leading to more purchased forages and grains. This could be made worse if milk price falters during the rest of the year eroding away the margin and raising cost of production. There is no simple approach to dealing with the multitude of external forces influencing our industry. However, knowing costs of production on the cropping enterprise can help avoid going too far down the rabbit hole.
| Forage | Yield/acre
as-fed tons | 2020 cost
$/A ($/T) | Inflation Rate
8% $/A ($/T) | Inflation Rate
16% $/A ($/T) | Inflation Rate
24% $/A ($/T) |
|---|
| Corn Silage | 14 | $455 ($33) | $495 ($35) | $542 ($39) | $599 ($43) |
| Corn Silage | 20 | $417 ($21) | $453 ($23) | $496 ($25) | $549 ($27) |
| Corn Silage | 25 | $488 ($20) | $530 ($21) | $581 ($23) | $642 ($26) |
| Small grain silage | 4 | $258 ($65) | $280 ($70) | $307 ($77) | $339 ($85) |
| Small grain silage | 6 | $250 ($42) | $272 ($45) | $298 ($50) | $329 ($55) |
| Small grain silage | 9 | $294 ($32) | $320 ($36) | $350 ($39) | $387 ($43) |
Source: Penn State Extension Dairy Business Management Team’s 2020 Crop Summary Report.
Note: costs include seed, fertilizer, chemical, custom hire, rent, overheads, owner draw, and loan payments.
Table 2. Corn grain and soybean costs per acre and per ton including inflation rates.
| Grains | Yield/acre
as-fed bushels | 2020 cost
$/A ($/bu) | Inflation Rate
8% $/A ($/bu) | Inflation Rate
16% $/A ($/bu) | Inflation Rate
24% $/A ($/bu) |
|---|
| Corn | 125 | $417 ($3.34) | $453 ($3.63) | $496 ($3.97) | $549 ($4.39) |
| Corn | 201 | $444 ($2.21) | $483 ($2.40) | $529 ($2.63) | $584 ($2.91) |
| Soybeans | 49 | $313 ($6.39) | $340 ($6.94) | $373 ($7.60) | $412 ($8.40) |
| Soybeans | 69 | $365 ($5.29) | $397 ($5.75) | $435 ($6.30) | $480 ($6.96) |
Source: Penn State Extension Dairy Business Management Team's 2020 Crop Summary Report.
Note: costs include seed, fertilizer, chemical, custom hire, rent, overheads, owner draw, and loan payments.
Economic perspective:
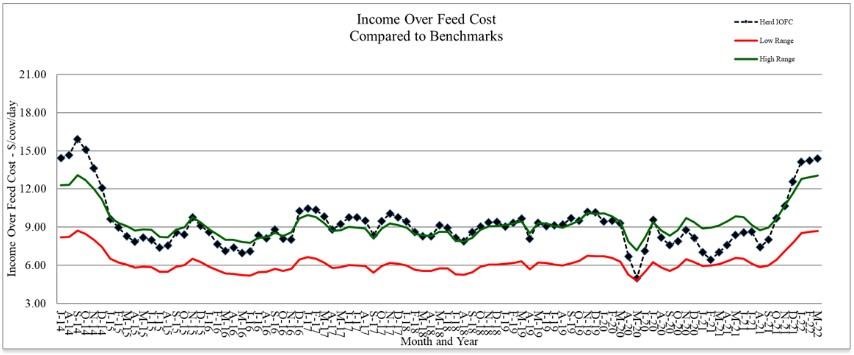
Monitoring must include an economic component to determine if a management strategy is working or not. For the lactating cows, income over feed cost is a good way to check that feed costs are in line for the level of milk production. Starting with July 2014's milk price, income over feed cost was calculated using average intake and production for the last six years from the Penn State dairy herd. The ration contained 63% forage consisting of corn silage, haylage and hay. The concentrate portion included corn grain, -candy meal, sugar, canola meal, roasted soybeans, Optigen and a mineral vitamin mix. All market prices were used.
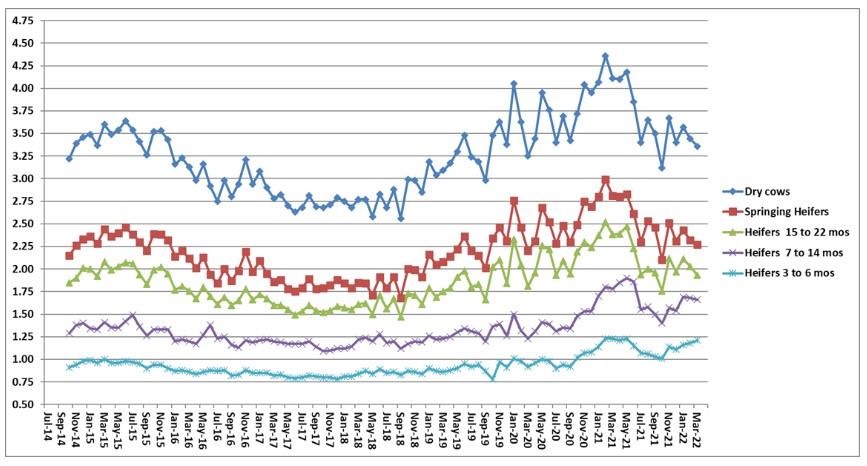
Also included are the feed costs for dry cows, springing heifers, pregnant heifers, and growing heifers. The rations reflect what has been fed to these animal groups at the Penn State dairy herd. All market prices were used.
Income over feed cost using standardized rations and production data from the Penn State dairy herd.

Note: March's Penn State milk price: $25.89/cwt; feed cost/cow: $7.35; average milk production: 84 lbs.
Feed cost/non-lactating animal/day.

Source : psu.edu