Bianca Moebius-Clune, Margaret Ball, Harold van Es, Jeff Melkonian – School of Integrative Plant Science, Soil and Crop Sciences Section – Cornell University
Adapt-N is an on-line tool that provides location-specific, weather-adjusted nitrogen (N) recommendations for corn. At sidedress time, critical early-season weather that strongly influences actual N needs is incorporated into the recommendation. To accomplish this, the tool uses 1) a simulation model that was developed and calibrated through field research over several decades, 2) high resolution 2.5 x 2.5 mile daily temperature and precipitation information, and 3) soil and crop management information entered via a web interface on any internet-capable device. Adapt-N’s cloud-based environment (central data server, high security, and accessibility through desktop, laptop and mobile devices, future embedding in other farm software) offers a user-friendly experience.
We conducted a total of 104 strip trials in 2011, 2012, and 2013 in New York and Iowa (Figure 1) to beta test Adapt-N for its ability to improve recommendations for corn N need at sidedress time. Yield data and simulated losses across trials show that the Adapt-N tool significantly increased grower profits, while decreasing N inputs and environmental losses, as summarized in this article. In 2014, Adapt-N was commercialized through a public-private partnership between Cornell University and Agronomic Technology Corporation (ATC, see http://www.adapt-n.com/). The partnership aims to sustain and broaden the tool’s availability, customer service, usability, and integration with existing farm management technologies, while allowing for continued research and development at Cornell University.
Methods
We completed 67 replicated strip trials in New York (14 in 2011; 42 in 2012; 11 in 2013) and 37 trials in Iowa (9 in 2011; 19 in 2012; 9 in 2013) on commercial and research farms throughout each state (Figure 1. One 2012 trial in Minnesota is included with the Iowa trials).
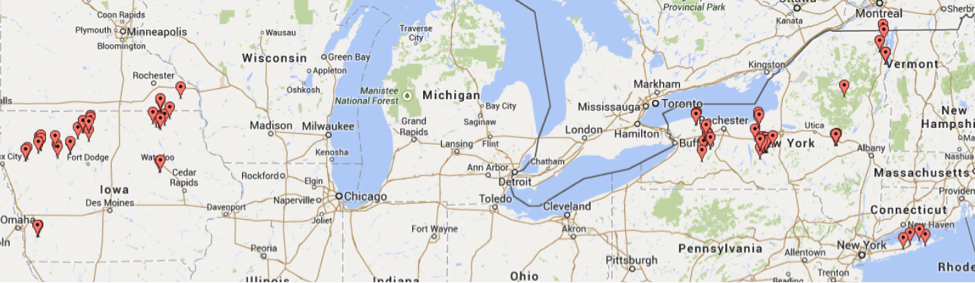
Figure 1. Map of 2011-2013 trial locations (map courtesy of batchgeo.com)
Sidedress treatments involved at least two rates of nitrogen, a conventional “Grower-N” rate based on current grower practice (G) and an “Adapt-N” recommended rate (A). An Adapt-N simulation was run for each field just prior to sidedressing to determine the optimum weather-adjusted N rate.
Yields were measured by weigh wagon, yield monitor, or in a few cases by representative sampling (two 20 ft x 2 row sections per strip). Partial profit differences between the Adapt-N and Grower-N practices were estimated using prices of $0.50/lb N, $5/bu grain, $50/T silage, and $8/ac operational savings if sidedress was avoided in either the Adapt-N or Grower treatment. Yields were used as measured, regardless of statistical significance, since the statistical power to detect treatment effects for a single experiment is inherently low.
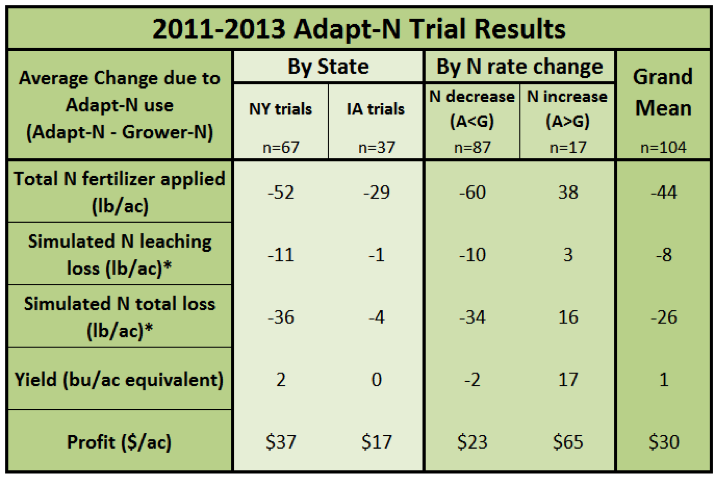
Table 1. Agronomic, economic and environmental assessment of model performance in 2012. Values are average differences resulting from Adapt-N use (Adapt-N minus Grower-N treatment) such that a negative number shows a decrease due to Adapt-N, a positive number shows an increase due to Adapt-N. *Simulated N leaching losses and N total losses do not include 2011 IA trials – data not available.
Total N losses to the environment (atmosphere and water) and N leaching losses were simulated by Adapt-N for each N treatment, through the end of each growing season. End dates for N loss simulation were October 30, 2011 (NY trials only), December 15, 2012, and December 31, 2013. More detailed descriptions of each year’s methods and results were provided in previous WCU articles (Moebius-Clune et al., 2012, 2013, and 2014).
Agronomic and Economic Comparison
Adapt-N rates resulted in average N input reductions of 52 lbs/ac in NY, 29 lbs/ac in IA, and 44 lbs/ac overall (Table 1). Profit gains from the use of Adapt-N were considerable. Profits increased in 81% of all NY trials, in 70% of all IA trials, and in 77% overall when growers followed Adapt-N recommendations (Figure 2). Profit gains of $30/ac on average ($37/ac in NY, $17/ac in IA) were obtained most frequently due to reductions in N inputs, without significant yield loss: +1 bu/ac on average across all trials. Most collaborating growers were already using progressive N management including sidedressing, so that benefits achieved in these trials can be considered to be a conservative estimate of potential benefits of using Adapt-N. Benefits will be higher for growers who currently use few N best management practices.