By Dale Lattz
Department of Agricultural and Consumer Economics
University of Illinois
Bradley Zwilling
Illinois FBFM Association and Department of Agricultural and Consumer Economics
University of Illinois
This article examines working capital to value of farm production for selected producer characteristics. Working capital to Value of Farm production is one of the traditional measures of liquidity suggested by the Farm Financial Standards Council (FFSC), with others being current ratio and working capital. Overall, working capital to value of farm production has declined since 2013.
Background
The Financial Guidelines for Agriculture developed by the Farm Financial Standards Council (FFSC) identified five general financial measures when evaluating the financial performance of the farm firm. These include liquidity, solvency, profitability, repayment capacity and financial efficiency. Different financial measures were identified and defined for each general group. There are three measures listed for measuring liquidity: current ratio, working capital and working capital/gross revenues ratio. Financial analysis by some groups substitute value of farm production (VFP) for gross farm revenue. The FFSC recognizes both methods of calculation in their guidelines.
Using Illinois Farm Business Farm Management (FBFM) Association data, this article examines working capital to value of farm production for selected producer characteristics. While the traditional measures of a farm’s liquidity, the current ratio and working capital, are common measures historically used, the measurement of working capital to value of farm production also takes into consideration a farm’s size. Obviously, a larger farm needs more working capital than a smaller farm to have the same level of liquidity. In addition, the higher this figure, the better, that is stronger liquidity.
Working Capital to VFP by Farm Type
Figure 1 charts the median (50 percent of the farms above and below this figure) measurement of working capital to value of farm production by farm type. The four farm types are hog, grain, dairy and beef farms based on FBFM’s definition of these farms. Grain farms are defined as farms where the value of feed fed was less than 40 percent of the crop returns. Hog, beef and dairy farms are defined as farms where the value of feed fed was more than 40 percent of crop returns and the livestock enterprise (hog, dairy or beef) received the majority of the value of feed fed.
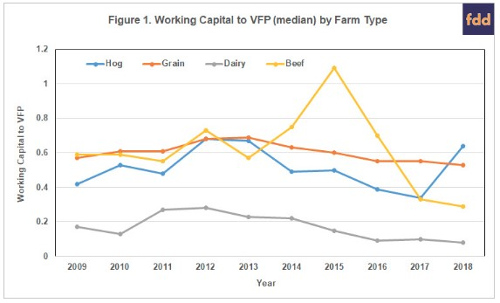
Generally, working capital to VFP has declined since 2013 for most farm types. The 2012-13 period was the end of the era of high grain prices. Since then, we have seen financial deterioration in most farms as farm incomes have declined.
Hog and beef farms seem to have more variability in this measure. This is explained by the fact that the variability of livestock prices not only effects livestock sales for the year but also has an effect on inventory values that come into play when calculating accrual farm incomes. Finally, dairy farms have a lower working capital to VFP than the other three farm types. The majority of a dairy farm’ assets are in the dairy herd, an intermediate asset, and buildings, a long-term asset. Dairy farms also benefit from a monthly income stream in milk sales that allow them to survive on lower liquidity.
Working Capital to VFP by Operator Age