By Scott Irwin
Department of Agricultural and Consumer Economics
University of Illinois
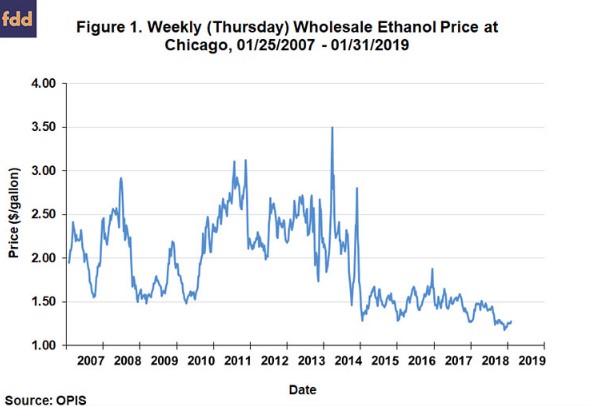
The U.S. ethanol industry was rocked by low prices in 2018, especially in the second half of the year when prices reached their lowest levels in over a decade (Figure 1). At times in recent months, the price of ethanol at plants approached the unheard of low level of $1 per gallon. The ethanol industry has placed much of the blame for the low prices on small refinery exemptions (SREs) granted under the Renewable Fuel Standard (RFS) by the U.S. EPA. While there is no doubt that SREs have opened a backdoor mechanism for the EPA to reduce the statutory and obligated RFS volumes, the evidence shows that the physical use of ethanol has declined little if any during the last year (
September 13, 2018;
December 13, 2018;
January 16, 2019;
January 24, 2019;
January 31, 2019). The reason is that the price of ethanol until very recently has been low relative to gasoline, which means that ethanol is a price competitive component of gasoline blends (E10, E15, or E85). Then what has been driving ethanol prices so low? The purpose of this article is to investigate the factors that have pushed ethanol prices to such historically low levels.
Analysis
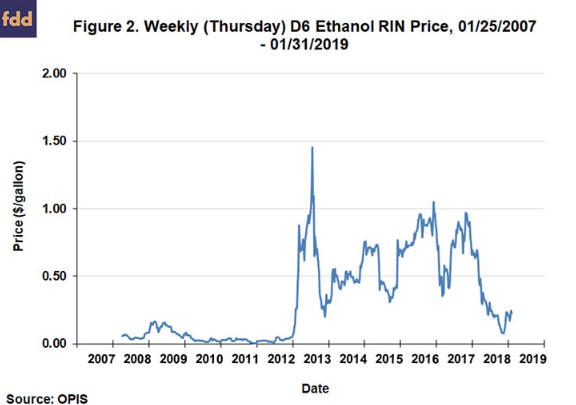
The starting point for the analysis is Figure 2, which shows the weekly price of D6 ethanol RINs from April 3, 2008 through January 31, 2019. RIN prices function as the mechanism to incentivize use of biofuels under the RFS. Notice that the price of D6 RINs plummeted starting in December 2017, falling from around $0.90 to under $0.10 per gallon. The crash in D6 RIN prices lines up with the timeline of when EPA began granting SREs in large numbers. This increased the supply of RINs substantially, and naturally, led to a large decline in RIN prices. It was argued by many in the corn ethanol industry that this would cause a decline in the physical consumption of ethanol because of the reduced incentives that could be passed on to gasoline blenders through RIN prices. As noted above, there is little if any evidence that the physical use of ethanol has declined during the last year. The aggregate blending rate for ethanol in 2018 was only a smidgen lower than in 2017 and well within normal statistical variation.
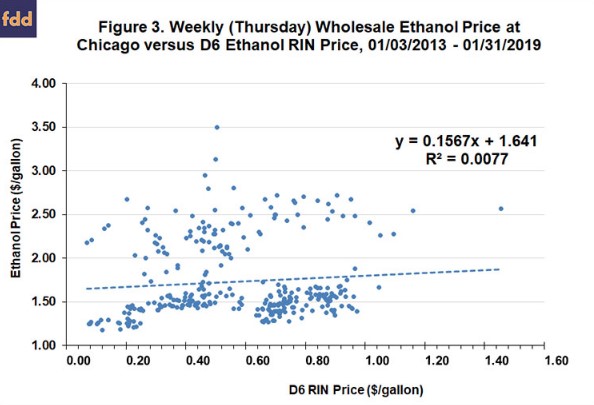
Some have argued that even if the blending rate for ethanol has not changed, that the decline in D6 RIN prices caused a decline in the demand for ethanol in the physical market, which in turn caused a drop in ethanol prices. We examine this argument with the aid of Figure 3, which is a scatterplot of weekly wholesale ethanol prices in Chicago and D6 RIN prices over January 3, 2013 through January 31, 2019. The sample starts in 2013 in order to avoid distortions brought about by the huge difference in RIN prices before and after 2013. Figure 3 clearly shows that there is almost no correlation between the level of ethanol prices and D6 RIN prices. This means that any incentive effect from D6 prices is not translated in the level of ethanol prices.
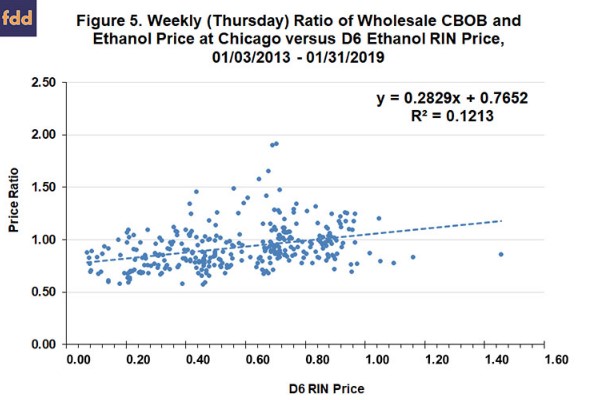
Another iteration of the previous argument is that the decline in RIN prices after December 2017 did not impact the level of ethanol prices, but rather, the spread between ethanol and gasoline prices. In other words, blenders require a certain spread between the price of gasoline and ethanol, and if RIN prices decline this means that ethanol prices have to drop relative to gasoline in order to keep the spread at the needed level. The data needed to examine this argument are shown in Figure 3, which presents the weekly wholesale ethanol and CBOB gasoline prices in Chicago over January 25, 2007 through January 31, 2019. The figure shows that there was a sharp rise in the spread between CBOB and ethanol prices starting in late 2017, as CBOB prices increased and ethanol prices drifted lower. This widening of the spread continued thought September 2018 when CBOB prices dropped sharply and approached parity with ethanol prices. So, the behavior of the spread between CBOB and gasoline prices through September 2018 was consistent with this version of the RIN incentive argument. However, the decline in CBOB prices and the narrowing of the spread back to parity after September 2018 contradicts the argument. RIN prices remained low yet the spread between CBOB gasoline and ethanol prices collapsed. Figure 5 provides further evidence that in general there is no systematic relationship between the spread between CBOB and ethanol prices (measured as a ratio) and D6 RIN prices. The slight positive slope in the relationship is the opposite of what one would expect if RIN prices moved opposite of the spread between CBOB and ethanol and D6 prices.
The analysis to this point has shown that neither ethanol prices nor the spread between ethanol and gasoline prices is related to D6 RIN prices. This means that demand shifts in the domestic ethanol market are highly unlikely to be the primary driver of low ethanol prices in the last year. The first clue of what has actually been behind the low prices is found in Figure 6, which presents a simple conceptual model of the U.S. domestic ethanol market that has been used in previous farmdoc daily articles (e.g.,
February 15, 2018). The model represents the supply of ethanol producers and demand from gasoline blenders at the wholesale level on an annual basis. Quantity is expressed here as a percent of gasoline use in order to focus on the blend rate. Retail demand at the consumer level is implicitly represented by a simple percentage markup of the wholesale demand shown in Figure 6. The first segment of the demand curve is assumed to be flat (perfectly elastic) up to the blend wall for ethanol prices equal to CBOB gasoline prices. Our research (farmdoc daily,
March 15, 2017) shows that the octane benefit of ethanol in gasoline blends approximately offsets the energy penalty for ethanol, and hence, the assumption of a breakeven price equal to the CBOB price. The second segment of the demand curve is vertical, reflecting the E10 blend wall, which is the physical limit of 10 percent ethanol blends in the gasoline supply. The third segment has a small amount of price sensitivity to reflect the demand for higher ethanol blends, namely E15 and E85. This segment adds at most a few hundred million gallons to ethanol consumption because infrastructure constraints are assumed to restrict the ability to expand consumption of these higher ethanol blends. Note also that imports and exports of ethanol are ignored in the model for simplicity. This does not affect the main conclusions drawn from the model.
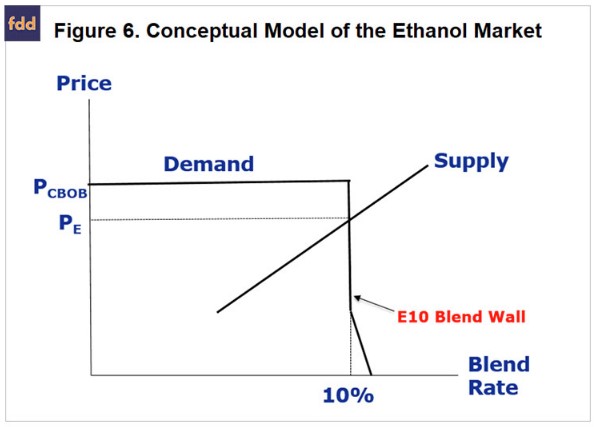
The ethanol market equilibrium shown in Figure 6 has two key features. First, the position of the supply curve results in ethanol consumption at the E10 blend wall but no consumption of higher ethanol blends. This is an approximation of market reality in recent years. Second, the equilibrium ethanol price is below the price of CBOB gasoline, which means that adding ethanol up to 10 percent in gasoline blends ultimately lowers the cost of gasoline at the pump to consumers (assuming the lower cost of ethanol is fully passed on to consumers). Again, this appears to mirror market reality in recent years.
The next clue is found in Figure 7, which presents the implied ethanol blend rate on a monthly basis over January 2007 through November 2018. This measure of the aggregate ethanol blend rate has been discussed extensively in these earlier farmdoc daily articles (
September 13, 2018;
December 13, 2018). In theory, the measure includes all domestic sources (E10, E15, and E85) in the numerator of the blend rate. The key observation from this chart is that the ethanol blend rate since 2016, with a few exceptions, has moved in a small range around 10 percent. This is a crucial piece of the puzzle in terms of understanding what has been driving ethanol price so low. Note that the relatively large variation in late 2017 and early 2018 can be traced to measurement errors in survey estimates of ethanol exports (farmdoc daily,
December 13, 2018).
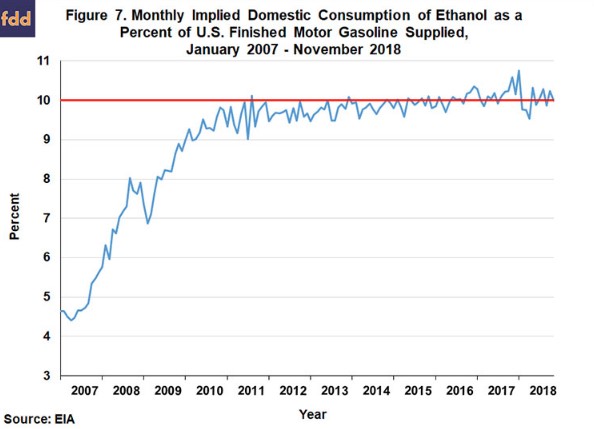
Returning to Figure 6, the nearly constant ethanol blend rate means that the demand curve for ethanol cannot have shifted much in recent years. Imagine turning Figure 7 on its side and plotting the blend rate observations in Figure 6. They would all lie in a narrow range around along the vertical line for the 10 percent blend wall. The crucial implication is that variation in the price of ethanol has to be driven primarily by shifts in the supply curve for ethanol. Figure 8 shows exactly how shifts in the supply curve generate changing ethanol prices with a constant 10 percent blend rate. In particular, the rightward shifts in the supply of ethanol (1 to 3) lead to decreasing ethanol prices.

In sum, the analysis to this points to increasing supply of ethanol as the main culprit in explaining low ethanol prices. Figure 9 shows U.S. ethanol production on an annual basis over 2010 through 2018. Full year production is not available for 2018, so the missing December observation is estimated based on weekly ethanol production. The figure confirms that ethanol production has increased substantially in recent years. Since 2014, ethanol production in the U.S. increased a total of 1.8 billion gallons and looks to have topped 16 billion gallons for the first time in 2018. Returning to Figure 1, the impact of the rising production since 2014 on ethanol prices is obvious. Ethanol prices dropped sharply in late 2014 and have never really recovered. This rise in production has simply been too much for the domestic (and export) fuel markets to absorb.
Implications
Ethanol prices have been driven to very low levels in the last year. Most of the discussion about the low prices has focused on small refinery exemptions (SREs) granted under the RFS. The SREs drove down D6 ethanol RIN prices and this, in turn, is argued to have reduced demand for ethanol in physical markets through an incentive effect. We analyze different versions of the D6 incentive arguments in this article and find no evidence of a relationship between D6 RIN prices and ethanol prices or D6 prices and the spread between CBOB gasoline and ethanol prices. Instead, the data and economics point to increasing supply as the primary driver of low ethanol prices. Ethanol production in the U.S. looks to have topped 16 billion gallons for the first time in 2018 and this has simply been too much for the domestic (and export) fuel markets to absorb.