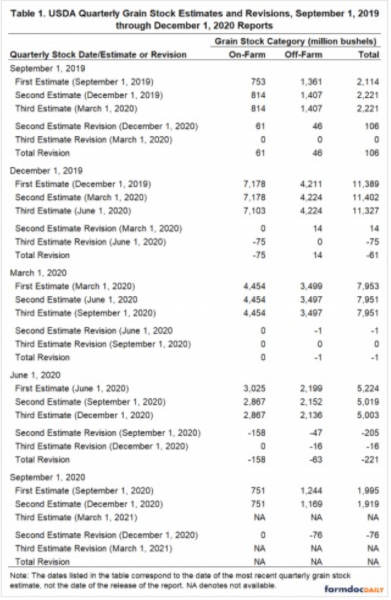
Several interesting patterns emerge in Table 1 for the five recent quarterly stock estimates in corn. Second estimate revisions occur for all five quarterly estimates and third estimate revisions occur for two of the five. The schedule of revisions is consistent with the USDA revisions policy, except the third revision of the December 1, 2019 corn stock estimate. This revision occurred in the June 1, 2020 report, which was neither the immediately following quarter or the December 1 report. Both on-farm and off-farm stock estimates for corn were revised over this period. It is especially interesting to observe that all five quarterly off-farm estimates were revised, with the June 1, 2020 estimate being revised twice. Given that these are meant to be a census of off-farm facilities, it is especially puzzling that both positive and negative revisions were made over such a short period of time. The policy reviewed in the previous section indicates these changes should reflect late reports or errors. One presumes that late reports add to off-farm totals, which may explain positive revisions. It is not clear what kind of errors would explain the negative revisions to off-farm stocks. Finally, the basis for making two of the three revisions to the on-farm stock estimates (December 1, 2019 and June 1, 2020 reports) is not clear because no new production estimates were published on the revision dates.
The next step of the analysis is to analyze the size of revisions for the last five quarterly stock estimates compared to the historical distribution of revisions. We do this by computing the revision between first estimate published in grain stock reports and final stock estimates as reported in the current vintage of the USDA QuickStats online database for December 1, 1990 through December 1, 2020. Note that these revisions reflect not only the quarter-to-quarter revisions documented in Table 1, but also historical revisions associated with the five-year Agricultural Census. We take the absolute value of revisions and then rank order the revisions in order to form a historical distribution.
Table 2 presents the distribution of revisions for quarterly corn stock estimates and compares these to the four largest revisions since September 1, 2019. Historically, revisions to quarterly stock estimates for corn have been very small, with 84 percent of the revisions less than 5 million bushels in absolute value. It is therefore not surprising that the average revision size over this period was only 4 million bushels. Only 14 percent of revisions were between 11 and 20 million bushels in absolute value and just three revisions were between 21 and 51 million bushels. It is from this perspective that the size of recent corn stock revisions really stands out. There is nothing in the historical record that compares to the magnitude of recent revisions. The individual revisions listed in Table 2 are by an extremely wide margin the largest four revisions over the last 30 years.
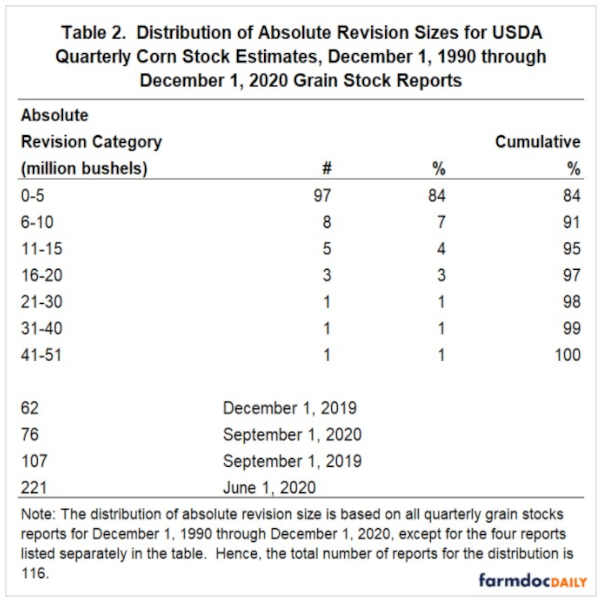
Further perspective on the shocking size of recent revisions can be gained by considering the largest revision in absolute terms, 221 million bushels, for the June 1, 2020 quarterly corn stock estimate. This revision is more than 50 times the size of the average revision. Even more incredibly, this revision is a “32 sigma event,” meaning that it is more than 30 standard deviations above the mean using the sample of quarterly grain stock reports from December 1, 1990 through June 1, 2019. From a historical standpoint, the four listed revisions meet any reasonable definition of an “outlier.”
Finally, the size of recent revisions can be considered relative to the standard errors for the quarterly corn stock estimates. The standard errors strictly only apply to the on-farm component of corn stock estimates, so we will limit comparisons to the two cases of revisions to on-farm stocks. The first is the on-farm revision for December 1, 2019 of -75 million bushels. Applying the 1.5 percent standard error listed in that report to the initial estimate of 7,178 million bushels, results in a standard error of 115 million bushels. The revision of 75 million bushels was therefore well within a one-standard error band. The second is the on-farm revision for June 1, 2019 of -158 million bushels. Applying the 2.4 percent standard error listed in that report to the initial estimate of 3,025 million bushels, results in a standard error of 73 million bushels. The revision of 158 million bushels was therefore well outside a one-standard error band. These comparisons provide mixed results as to the size of recent revisions because standard errors are much larger than the typical historical revision to quarterly grain stock estimates.
Implications
USDA quarterly grain stock estimates for corn are an important benchmark for virtually all participants in the grain markets. These estimates provide key readings on the pace of consumption during the marketing year and provide the official ending stocks for USDA balance sheets. While the USDA has always had a process for revising the initial quarterly estimates in subsequent reports, these revisions for corn have historically been very small. The average absolute revision of quarterly stock estimates for corn over the last 30 years has only been 4 million bushels and 95 percent of revisions have been 15 million bushels or less. Something very dramatic changed with USDA revisions policy in the last two marketing years. By an extremely wide margin, the largest four revisions for corn over the last 30 years occurred between September 1, 2019 and September 1, 2020. The largest of the recent revisions in absolute terms, 221 million bushels, is more than 50 times the size of the historical average revision.
The shocking size of quarterly grain stocks revisions for corn the last two marketing years is, quite frankly, out of character for the USDA, which in the past has tended to be very careful and conservative in making changes to statistical estimation procedures. USDA crop estimates have developed a reputation as the “gold standard” for good reasons. There are two possible explanations for the dramatic revisions of the last two marketing years. Either the USDA made a major change in revisions procedures or some kind of significant problem has developed with the survey data or estimation process. To date, the USDA has not provided a specific explanation for the very large revisions in quarterly corn stock estimates. It is reasonable to expect the USDA to tell users what is going on. Without such an explanation, it is not clear how market participants can confidently anticipate and interpret quarterly corn stocks estimates going forward.
Source : illinois.edu