The analysis here focuses on USDA planted acreage revisions between the March Prospective Plantings and the January Crop Production Annual Summary reports. The January estimate is usually considered the “final” for a crop year. Hence, the change in estimates between March and January is the most relevant measure of the total revision for a crop year to the market. In our previous work, we examined USDA planted acreage revisions for corn, soybeans, combined corn and soybeans, and all principal crops (farmdoc daily, April 14, 2021; April 21, 2021; April 28, 2021; May 19, 2021). Since the results are generally similar for these four series of acreage revisions, we focus the discussion here on corn acreage revisions in order to preserve space. We update our previous results for corn with data for 2021. It also should be kept in mind that we have not examined acreage revisions for all of the dozens of crops that the USDA includes in acreage reports. Nonetheless, we expect that the results for corn, soybeans, combined corn and soybeans, and principal crops are representative of most crops.
We draw four main findings from our analysis of USDA planted acreage revisions:
#1) Revisions to acreage estimates in the March Prospective Plantings report are statistically unbiased
Figure 1 shows revisions to USDA planted acreage estimates for corn over 1990-2021. Revisions are computed as the January estimate minus the March estimate, so positive numbers mean that planted acreage estimates increase between March and January, and vice versa. The first thing to notice is how close the average revision, -0.4 million acres, is to zero. It is no surprise that the average is not significantly different from zero. Hence, from a statistical standpoint, the data indicate that the average revision for corn acreage estimates is equal to zero. This is exactly what you would expect from a statistical revision process that is unbiased.
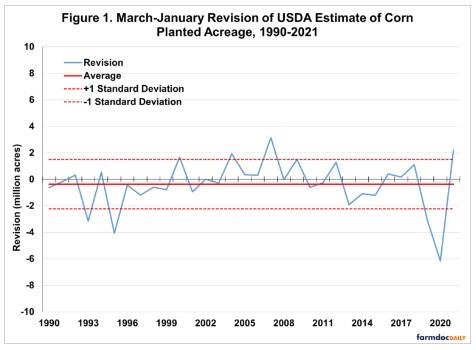
The fact that revisions to USDA planted acreage are unbiased, does not imply that revisions in any given year are small. This is highlighted in Figure 1 by the plus/minus one standard deviation bands around the average revision. With a standard deviation of 1.9 million acres, the bands are roughly plus/minus two million acres. In other words, it is not unusual for the initial planted acreage estimates for corn found in the March Prospective Plantings report to be revised upward or downward as much as two million acres. The implication is that we should expect fairly substantial acreage revisions in any given year, but over time, the positives and negatives balance out.
#2) Revisions to acreage estimates in the March Prospective Plantings report should not be statistically unbiased after accounting for prevented plant acreage
It is normal that all acres intended to be planted to crops ends up actually being planted due to weather delays and natural disasters such as flooding. Prevented plant coverage under the Federal crop insurance program provides payments when farmers are unable to plant within a normal time window (e.g., farmdoc daily, May 14, 2019). It is reasonable to assume that survey respondents to the March Prospective Plantings report expect zero acres of prevented plant for their farm operations. The implication is that USDA March planting intentions represent the sum of what will actually be planted and prevented plant. It then follows that the revision of USDA planted acreage estimates between March and January should, on average, equal the magnitude of prevented plant acreage. So long as prevented plant acreage is positive, then the USDA March planting intention estimate should not be an unbiased estimate of the January final planted acreage estimate. These two should differ, on average, by the amount of prevented plant acreage. It is quite puzzling why this is not actually the case, as reviewed above in point #1.
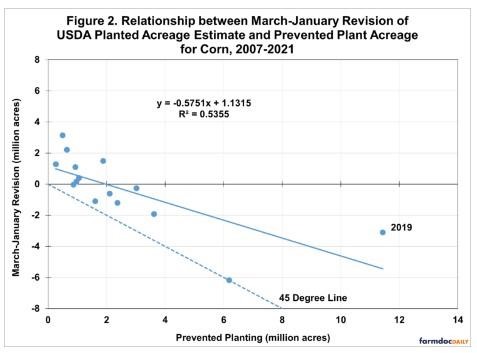
We examine the historical relationship between USDA planted acreage revisions and prevented plant acreage for corn over 2007-2021 in Figure 2. The scatter of data has the expected downward slope, with larger prevented plant acreage tending to be associated with negative March-January USDA planted acreage revisions. However, the estimated regression line (solid blue) sits above and to the right of the 45 degree line (dashed blue). What this means is that March-January revisions are smaller on average than the level of prevented plant acreage. As an example, if prevented plant is 4 million acres, the predicted March-January revision on the 45 degree line is -4 million acres. But the predicted level of the March-January revision on the regression line is only -1.2 million acres, or a difference of 2.8 million acres. It’s as if respondents to the March Prospective Plantings report expected there would be 2.8 million acres of prevented plant acreage but did not account for it in their initial survey responses.
#3) It is difficult to predict revisions to acreage estimates in the March Prospective Plantings report based on available market information
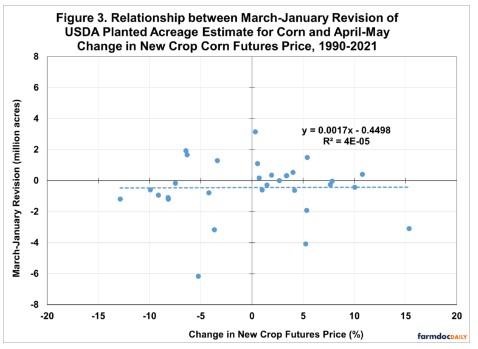
It is frequently argued that the grain markets “buy” or “sell” planted acreage during the spring planting period through increasing or decreasing, respectively, new crop futures prices. In this regard, we consider the relationship between USDA corn acreage revisions and price changes during the two-month period that immediately follows the release of the March Prospective Plantings report. Specifically, we collect new crop futures prices for corn on the business day immediately following the release of the Prospective Plantings report and the last business day of May. The day following the release of the Prospective Plantings report is used as the base for computing percentage price changes over the two-month April-May period. The April-May period brackets the period when the vast majority of adjustments in corn and soybean acreage decisions can be made in response to price changes. Figure 3 shows the revisions to USDA planted acreage estimates for corn over 1990-2021 and new crop futures prices changes in April-May. There is no evidence of a statistical relationship, with an R2 of essentially zero. New crop futures price changes over April-May have no ability to predict USDA corn and soybean acreage revisions.
We consider a number of other price-based variables in earlier work (farmdoc daily, April 21, 2021), and all show little or no ability to predict USDA planted acreage revisions. However, we do find that there is a positive and statistically significant relationship between corn planting progress and acreage revisions. The overall explanatory power of the regression is fairly modest, which means that a wide range of acreage revisions is possible for each level of corn planting progress. No useful evidence is found of a relationship between soybean planting progress and soybean acreage revisions.
#4) Acreage revisions in the June Acreage report dominate later revisions
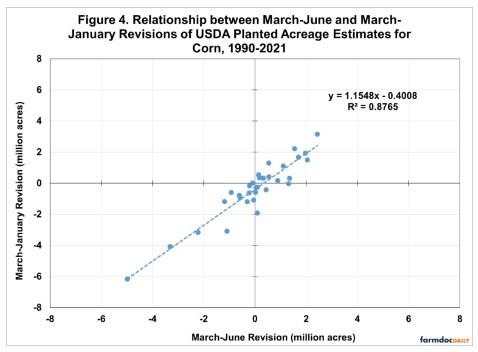
An important question for market participants is how much of the total revision over March-January occurs in March-June compared to June-January. This amounts to asking how much of the total acreage revision is revealed in the June Acreage report. Figure 4 shows the relationship between the March-June acreage revision for corn and the total March-January revision. The R2 for the regression is 88 percent, which shows that all but a small proportion of the total revision is revealed in the June Acreage report. The same regression for soybeans, combined corn and soybeans, and principal crops has an R2 of 77, 83, and 75 percent, respectively. It is not surprising then why the June Acreage report is considered to be such an important event by the market.
Implications
USDA planted acreage estimates function as benchmarks in the grain markets. Revisions to these estimates have important market impacts. In this article, we review what is known about revisions to USDA planted acreage estimates based on our previous research on the topic. We draw four main conclusions: #1) Revisions to acreage estimates in the March Prospective Plantings report are statistically unbiased; #2) Revisions to acreage estimates in the March Prospective Plantings report should not be statistically unbiased after accounting for prevented plant acreage; #3) It is difficult to predict revisions to acreage estimates in the March Prospective Plantings report based on available market information; and #4) Acreage revisions in the June Acreage report dominate later revisions. From a practical perspective, these findings imply that the best expectation of final USDA acreage estimates in March are those published in the March Prospective Plantings report and the best expectation in June are those published in the June Acreage report. The history of USDA revisions also implies that is not unusual for revisions to be in the millions of acres for major crops like corn and soybeans. That same history indicates that revisions are hard to predict, so we should continue to expect substantial market volatility after the revisions are released. Buckle up this Thursday when the USDA June Acreage report is released.
Source : illinois.edu