Overview
Corn and soybeans were up, cotton was down, and wheat was mixed for the week.
The USDA’s Prospective Plantings report caught markets off guard on March 31 causing limit moves in corn futures--out to July 2022 and soybean futures--out to January 2022. The March 31 futures market price move in harvest corn and soybean contracts of 5.2% (up 25 cents) and 5.6% (up 70 cents) is the equivalent of the DJIA moving 1,800 points in one day. For the report day, cotton futures were up 0.24-1.18 cents and wheat futures were up 16 cents.
Nationally, corn plantings were projected at 91.144 million acres, soybeans at 87.6 million acres, upland cotton at 11.894 million acres, and all wheat at 46.358 million acres. Prior to the report, market expectations were for 92-94 million acres of corn, 89-92 million acres of soybeans, and 12 million acres of cotton to be planted this spring. The lower projected acreage shocked the market which was already concerned about low ending stocks for corn and soybeans.
While the report relative to expectations was overwhelmingly bullish, I would caution putting too much stock into the projections shown. Weather and planting conditions are largely unknown at this point-in-time and prevented planting acres could move total acres planted 2-5 million acres up or down from the current USDA projections. Current prices will encourage producers to plant even in potentially less than ideal conditions.
Also released on March 31 was the Grain Stocks report, which indicated stocks as at March 1 of 7.70 billion bushels of corn, 1.56 billion bushels of soybeans, and 1.3 billion bushels of wheat. Grain stocks were slightly higher than anticipated, however export sales continue to remain robust indicating continued strong global demand into the summer.
In Tennessee, the Prospective Plantings report projected corn plantings at 1 million acres, soybeans at 1.7 million, and cotton at 290,000 acres.
Corn
Ethanol production for the week ending March 26 was 0.965 million barrels per day, up 43,000 barrels from the previous week. Ethanol stocks were 21.114 million barrels, down 0.695 million barrels compared to last week. Corn net sales reported by exporters for March 19-25 were down compared to last week with net sales of 31.4 million bushels for the 2020/21 marketing year and 2.4 million bushels for the 2021/22 marketing year. Exports for the same time period were down <1% from last week at 77.9 million bushels. Corn export sales and commitments were 100% of the USDA estimated total exports for the 2020/21 marketing year (September 1 to August 31) compared to the previous 5-year average of 80%. Across Tennessee, average corn basis (cash price-nearby futures price) strengthened or remained unchanged at North-Central, West-Central, Northwest, and West, and weakened at Mississippi River elevators and barge points. Overall, basis for the week ranged from 15 over to 40 over, with an average of 28 over the May futures at elevators and barge points. May 2021 corn futures closed at $5.59, up 7 cents since last Friday. For the week, May 2021 corn futures traded between $5.33 and $5.85. May/Jul and May/Dec future spreads were -14 and -75 cents. July 2021 corn futures closed at $5.45, up 10 cents since last Friday.
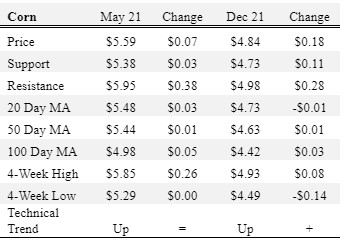
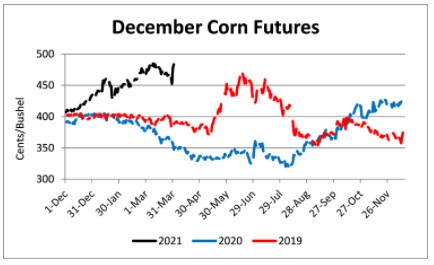
In Tennessee, new crop cash corn prices at elevators and barge points ranged from $4.33 to $4.98. December 2021 corn futures closed at $4.84, up 18 cents since last Friday. Downside price protection could be obtained by purchasing a $4.90 December 2021 Put Option costing 49 cents establishing a $4.41 futures floor.
Soybeans
Net sales reported by exporters were up compared to last week with net sales of 3.9 million bushels for the 2020/21 marketing year and 4.8 million bushels for the 2021/22 marketing year. Exports for the same period were down 8% compared to last week at 16.9 million bushels—a marketing year low. Soybean export sales and commitments were 99% of the USDA estimated total annual exports for the 2020/21 marketing year (September 1 to August 31), compared to the previous 5-year average of 89%. Across Tennessee, average soybean basis strengthened or remained unchanged at West, West-Central, North-Central, Northwest, and Mississippi River elevators and barge points. Basis ranged from even to 27 over the May futures contract. Average basis at the end of the week was 12 over the May futures contract. May 2021 soybean futures closed at $14.02, up 2 cents since last Friday. For the week, May 2021 soybean futures traded between $13.64 and $14.56. May/Jul and May/Nov future spreads were -6 and -139 cents. May 2021 soybean-to-corn price ratio was 2.51 at the end of the week. July 2021 soybean futures closed at $13.96, up 5 cents since last Friday.
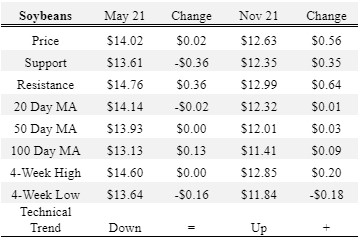
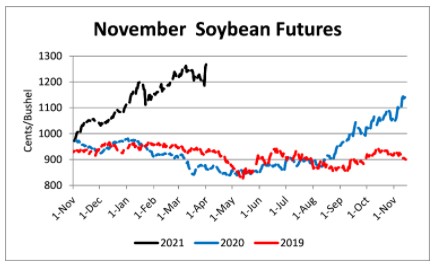
In Tennessee, new crop cash soybean prices at elevators and barge points ranged from $11.84 to $12.84. November 2021 soybean futures closed at $12.63, up 56 cents since last Friday. Downside price protection could be achieved by purchasing a $12.80 November 2021 Put Option which would cost 88 cents and set an $11.92 futures floor. Nov/Dec 2021 soybean-to-corn price ratio was 2.61 at the end of the week.
Cotton
Net sales reported by exporters were down compared to last week with net sales of 78,400 bales for the 2020/21 marketing year and 41,400 bales for the 2021/22 marketing year. Exports for the same time period were up 4% compared to last week at 324,700 bales. Upland cotton export sales were 102% of the USDA estimated total annual exports for the 2020/21 marketing year (August 1 to July 31), compared to the previous 5-year average of 97%. Delta upland cotton spot price quotes for March 31 were 78.63 cents/lb (41-4-34) and 80.88 cents/lb (31-3-35). May 2021 cotton futures closed at 77.95, down 2.43 cents since last Friday. For the week, May 2021 cotton futures traded between 77.75 and 81.52 cents. May/Jul and May/Dec cotton futures spreads were 1.32 cents and -0.04 cents. July 2021 cotton futures closed at 79.27 cents, down 2.14 cents since last Friday.