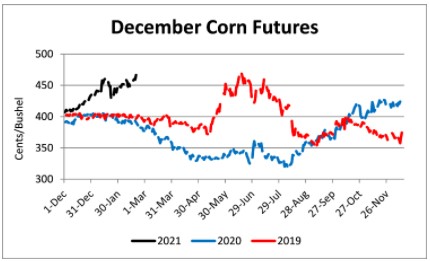
Ethanol production for the week ending February 12 was 0.911 million barrels per day, down 26,000 barrels from the previous week. Ethanol stocks were 24.297 million barrels, up 0.501 million barrels compared to last week. Corn net sales reported by exporters for February 5-11 were down compared to last week with net sales of 39.3 million bushels for the 2020/21 marketing year and 7.2 million bushels for the 2021/22 marketing year. Exports for the same time period were down 11% from last week at 54.6 million bushels. Corn export sales and commitments were 89% of the USDA estimated total exports for the 2020/21 marketing year (September 1 to August 31) compared to the previous 5-year average of 66%. Across Tennessee, average corn basis (cash price-nearby futures price) strengthened or remained unchanged at Northwest, North-Central, West-Central, West, and Mississippi River elevators and barge points. Overall, basis for the week ranged from 5 over to 41 over, with an average of 25 over the March futures at elevators and barge points. March 2021 corn futures closed at $5.42, up 4 cents since last Friday. For the week, March 2021 corn futures traded between $5.38 and $5.55. Mar/May and Mar/Dec future spreads were -1 and -82 cents. May 2021 corn futures closed at $5.41, up 5 since last Friday.
Corn | Mar 21 | Change | Dec 21 | Change |
Price | $5.42 | $0.04 | $4.60 | $0.12 |
Support | $5.31 | $0.06 | $4.46 | $0.02 |
Resistance | $5.61 | $0.11 | $4.70 | $0.13 |
20 Day MA | $5.41 | $0.04 | $4.49 | $0.01 |
50 Day MA | $4.99 | $0.10 | $4.38 | $0.04 |
100 Day MA | $4.55 | $0.07 | $4.18 | $0.03 |
4-Week High | $5.74 | $0.00 | $4.66 | $0.01 |
4-Week Low | $4.92 | $0.00 | $4.23 | $0.00 |
Technical Trend | Up | = | Up | = |
December 2021 corn futures closed at $4.60, up 12 cents since last Friday. Downside price protection could be obtained by purchasing a $4.60 December 2021 Put Option costing 44 cents establishing a $4.16 futures floor.
Soybeans
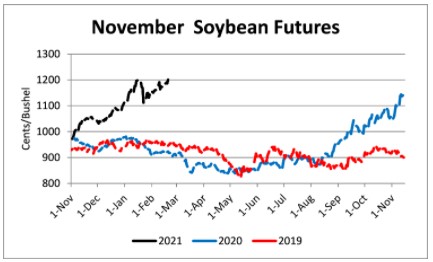
Net sales reported by exporters were down compared to last week with net sales of 39.3 million bushels for the 2020/21 marketing year and 6.2 million bushels for the 2021/22 marketing year. Exports for the same period were down 55% compared to last week at 36.8 million bushels. Soybean export sales and commitments were 98% of the USDA estimated total annual exports for the 2020/21 marketing year (September 1 to August 31), compared to the previous 5-year average of 81%. Across Tennessee, average soybean basis strengthened or remained unchanged at West-Central, West, North-Central, Northwest and Mississippi River elevators and barge points. Basis ranged from 3 under to 37 over the March futures contract. Average basis at the end of the week was 19 over the March futures contract. March 2021 soybean futures closed at $13.77, up 5 cents since last Friday. For the week, March 2021 soybean futures traded between $13.66 and $13.94. Mar/May and Mar/Nov future spreads were 3 and -181 cents. May 2021 soybean futures closed at $13.80, up 9 cents since last Friday. March 2021 soybean-to-corn price ratio was 2.54 at the end of the week.
Soybeans | Mar 21 | Change | Nov 21 | Change |
Price | $13.77 | $0.05 | $11.96 | $0.23 |
Support | $13.55 | $0.00 | $11.70 | $0.06 |
Resistance | $13.99 | $0.14 | $12.14 | $0.29 |
20 Day MA | $13.67 | -$0.02 | $11.61 | $0.01 |
50 Day MA | $13.21 | $0.17 | $11.33 | $0.12 |
100 Day MA | $12.07 | $0.15 | $10.67 | $0.10 |
4-Week High | $14.09 | -$0.27 | $12.02 | -$0.01 |
4-Week Low | $13.55 | $0.57 | $10.97 | $0.00 |
Technical Trend | Up | = | Up | = |
November 2021 soybean futures closed at $11.96, up 23 cents since last Friday. Downside price protection could be achieved by purchasing a $12.00 November 2021 Put Option which would cost 90 cents and set an $11.10 futures floor. Nov/Dec 2021 soybean-to-corn price ratio was 2.60 at the end of the week.
Cotton
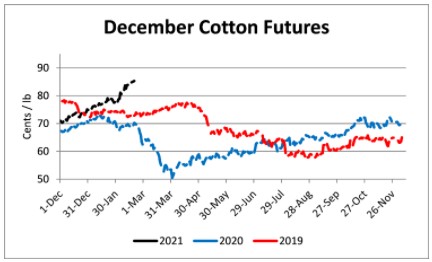
Net sales reported by exporters were down compared to last week with net sales of 119,500 bales for the 2020/21 marketing year and 2,100 bales for the 2021/22 marketing year. Exports for the same time period were down 28% compared to last week at 311,800 bales. Upland cotton export sales were 92% of the USDA estimated total annual exports for the 2020/21 marketing year (August 1 to July 31), compared to the previous 5-year average of 84%. Delta upland cotton spot price quotes for February 18 were 87.55 cents/lb (41-4-34) and 89.80 cents/lb (31-3-35). Adjusted World Price (AWP) increased 2.81 cents to 73.13 cents. March 2021 cotton futures closed at 88.95, up 1.68 cents since last Friday. For the week, March 2021 cotton futures traded between 87.3 and 89.36 cents. Mar/May and Mar/Dec cotton futures spreads were 1.53 cents and -3.45 cents. May 2021 cotton futures closed at 90.48 cents, up 1.82 cents since last Friday.
Cotton | Mar 21 | Change | Dec 21 | Change |
Price | 88.95 | 1.68 | 85.50 | 1.61 |
Support | 87.50 | 2.83 | 84.14 | 1.41 |
Resistance | 90.08 | 1.45 | 86.36 | 1.79 |
20 Day MA | 83.97 | 1.40 | 81.15 | 1.44 |
50 Day MA | 80.27 | 1.35 | 77.33 | 1.15 |
100 Day MA | 75.43 | 0.88 | 73.31 | 0.77 |
4-Week High | 89.36 | 2.03 | 85.68 | 1.69 |
4-Week Low | 79.75 | 0.00 | 77.26 | 1.06 |
Technical Trend | Up | = | Up | = |
December 2021 cotton futures closed at 85.5 cents, up 1.61 cents since last Friday. Downside price protection could be obtained by purchasing an 86 cent December 2021 Put Option costing 7.43 cents establishing a 78.57 cent futures floor.
Wheat
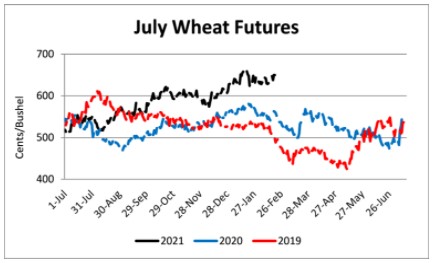
Wheat net sales reported by exporters were down compared to last week with net sales of 14.7 million bushels for the 2020/21 marketing year and 7.9 million bushels for the 2021/22 marketing year. Exports for the same time period were down 14% from last week at 14 million bushels. Wheat export sales were 88% of the USDA estimated total annual exports for the 2020/21 marketing year (June 1 to May 31), compared to the previous 5-year average of 90%. In Tennessee, spot wheat prices ranged from $6.74 to $6.93. March 2021 wheat futures closed at $6.50, up 14 cents since last Friday. March 2021 wheat futures traded between $6.38 and $6.69 this week. March wheat-to-corn price ratio was 1.20. Mar/May and Mar/Jul future spreads were 5 and -7 cents. May 2021 wheat futures closed at $6.55, up 14 cents since last Friday.
Wheat | Mar 21 | Change | Jul 21 | Change |
Price | $6.50 | $0.14 | $6.43 | $0.13 |
Support | $6.36 | $0.10 | $6.31 | $0.09 |
Resistance | $6.76 | $0.28 | $6.61 | $0.22 |
20 Day MA | $6.48 | -$0.03 | $6.36 | -$0.02 |
50 Day MA | $6.37 | $0.06 | $6.27 | $0.05 |
100 Day MA | $6.19 | $0.04 | $6.12 | $0.03 |
4-Week High | $6.76 | -$0.17 | $6.61 | -$0.09 |
4-Week Low | $6.24 | $0.00 | $6.15 | $0.00 |
Technical Trend | Down | = | Up | + |
In Tennessee, new crop wheat cash contracts ranged from $6.24 to $6.74. July 2021 wheat futures closed at $6.43, up 13 cents since last Friday. Downside price protection could be obtained by purchasing a $6.50 July 2021 Put Option costing 49 cents establishing a $6.01 futures floor.
Source : tennessee.edu