September wheat took a step back on Thursday and Friday after Wednesday’s 24 cent rally. The September contract has now rallied 63 cents ($4.71 to 5.34 ¾) since the low on June 26.
CFAP applications at USDA FSA are due August 28, 2020. Producers will be paid based on inventory subject to price risk held as of January 15, 2020. Do not leave money on the table!
Corn
Ethanol production for the week ending July 10 was 0.931 million barrels per day, up 17,000 barrels from the previous week. Ethanol stocks were 20.608 million barrels, down 0.012 million barrels compared to last week. Corn net sales reported by exporters for July 3-9 were up compared to last week with net sales of 38.6 million bushels for the 2019/20 marketing year and 25.8 million bushels for the 2020/21 marketing year. Exports for the same time period were down 7% from last week at 39.97 million bushels. Corn export sales and commitments were 96% of the USDA estimated total exports for the 2019/20 marketing year (September 1 to August 31) compared to the previous 5-year average of 102%. Across Tennessee, average corn basis (cash price-nearby futures price) weakened or remained unchanged at Memphis, Northwest Barge Points, Northwest, and Upper-middle Tennessee. Overall, basis for the week ranged from 1 over to 29 over, with an average of 14 over the September futures at elevators and barge points. September 2020 corn futures closed at $3.33, down 4 cents since last Friday. For the week, September 2020 corn futures traded between $3.22 and $3.34. Sep/Dec and Sep/Mar future spreads were 6 and 16 cents.
Corn | Sep 20 | Change | Dec 20 | Change |
Price | $3.33 | -$0.04 | $3.39 | -$0.05 |
Support | $3.28 | -$0.04 | $3.35 | $0.03 |
Resistance | $3.37 | -$0.22 | $3.43 | -$0.23 |
20 Day MA | $3.34 | -$0.02 | $3.42 | -$0.02 |
50 Day MA | $3.31 | $0.01 | $3.39 | $0.00 |
100 Day MA | $3.39 | -$0.03 | $3.48 | -$0.02 |
4-Week High | $3.55 | $0.00 | $3.63 | $0.00 |
4-Week Low | $3.15 | $0.00 | $3.22 | $0.00 |
Technical Trend | Up | = | Up | = |
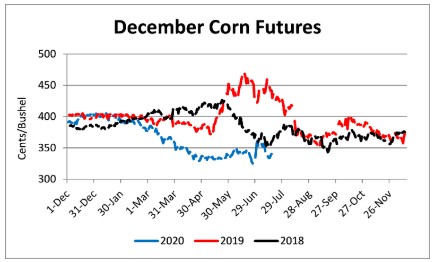
Nationally the Crop Progress report estimated corn condition at 69% good-to-excellent and 8% poor-to-very poor; corn silking at 29% compared to 10% last week, 14% last year, and a 5-year average of 32%; and corn dough at 3% compared to 2% last year and a 5-year average of 3%. In Tennessee, the Crop Progress report estimated corn condition at 73% good-to-excellent and 4% poor-to-very poor; corn silking at 64% compared to 43% last week, 76% last year, and a 5-year average of 82%; and corn dough at 19% compared to 6% last week, 28% last year, and a 5-year average of 22%. In Tennessee, new crop cash corn contracts ranged from $3.13 to $3.47. December 2020 corn futures closed at $3.39, down 5 cents since last Friday. Downside price protection could be obtained by purchasing a $3.40 December 2020 Put Option costing 15 cents establishing a $3.25 futures floor. March 2021 corn futures closed at $3.49, down 6 cents since last Friday.
Soybeans
Net sales reported by exporters were down compared to last week with net sales of 11.5 million bushels for the 2019/20 marketing year and 28.2 million bushels for the 2020/21 marketing year. Exports for the same period were up 23% compared to last week at 21.1 million bushels. Soybean export sales and commitments were 103% of the USDA estimated total annual exports for the 2019/20 marketing year (September 1 to August 31), compared to the previous 5-year average of 103%. Average soybean basis weakened at Memphis, Upper-middle, and Northwest Tennessee and strengthened at Northwest Barge Points. Basis ranged from 14 under to 35 over the August futures contract at elevators and barge points. Average basis at the end of the week was 17 over the August futures contract. August 2020 soybean futures closed at $8.98, up 11 cents since last Friday. For the week, August 2020 soybean futures traded between $8.70 and $8.98. Aug/Sep and Aug/Nov future spreads were -6 and -3 cents. September 2020 soybean futures closed at $8.92, up 7 cents since last Friday. August/September soybean-to-corn price ratio was 2.70 at the end of the week.
Soybeans | Aug 20 | Change | Nov 20 | Change |
Price | $8.98 | $0.11 | $8.95 | $0.05 |
Support | $8.90 | $0.20 | $8.88 | $0.18 |
Resistance | $9.02 | -$0.07 | $8.99 | -$0.16 |
20 Day MA | $8.82 | $0.04 | $8.84 | $0.02 |
50 Day MA | $8.65 | $0.04 | $8.70 | $0.03 |
100 Day MA | $8.66 | -$0.01 | $8.69 | -$0.02 |
4-Week High | $9.04 | $0.00 | $9.12 | $0.00 |
4-Week Low | $8.56 | $0.00 | $8.56 | $0.00 |
Technical Trend | Up | - | Up | - |
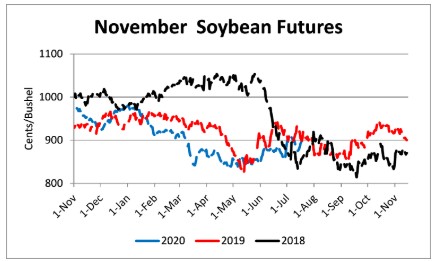
Nationally the Crop Progress report estimated soybean condition at 68% good-to-excellent and 7% poor-to-very poor; soybeans blooming at 48% compared to 31% last week, 19% last year, and a 5-year average of 40%; and soybeans setting pods at 11% compared to 2% last week, 3% last year, and a 5-year average of 10%. In Tennessee, soybean condition was estimated at 74% good-to-excellent and 4% poor-to-very poor; soybeans emerged at 97% compared to 91% last week, 95% last year, and a 5-year average of 95%; soybeans blooming at 34% compared to 19% last week, 35% last year, and a 5-year average of 40%; and soybeans setting pods at 10% compared to 2% last week, 10% last year, and a 5-year average of 13%. In Tennessee, new crop soybean cash contracts ranged from $8.57 to $9.13. Nov/Dec 2020 soybean-to-corn price ratio was 2.64 at the end of the week. November 2020 soybean futures closed at $8.95, up 5 cents since last Friday. Downside price protection could be achieved by purchasing a $9.00 November 2020 Put Option which would cost 29 cents and set an $8.71 futures floor.
Cotton
Net sales reported by exporters were down compared to last week with net sales cancellations of 17,500 bales for the 2019/20 marketing year and net sales of 29,100 bales for the 2020/21 marketing year. Exports for the same time period were down 5% compared to last week at 311,700 bales. Upland cotton export sales were 119% of the USDA estimated total annual exports for the 2019/20 marketing year (August 1 to July 31), compared to the previous 5-year average of 109%. Delta upland cotton spot price quotes for July 16 were 59.88 cents/lb (41-4-34) and 62.13 cents/lb (31-3-35). Adjusted World Price (AWP) decreased 1.22 cents to 50.26 cents.
Cotton | Dec 20 | Change | Mar 21 | Change |
Price | 61.94 | -2.37 | 62.63 | -2.20 |
Support | 61.48 | -1.09 | 62.19 | -0.96 |
Resistance | 62.74 | -2.73 | 63.37 | -2.52 |
20 Day MA | 61.74 | 0.83 | 62.41 | 0.86 |
50 Day MA | 59.93 | 0.57 | 60.62 | 0.53 |
100 Day MA | 58.74 | -0.33 | 59.59 | -0.32 |
4-Week High | 64.90 | 0.00 | 65.39 | 0.00 |
4-Week Low | 58.55 | 0.80 | 59.35 | 0.98 |
Technical Trend | Up | - | Up | - |
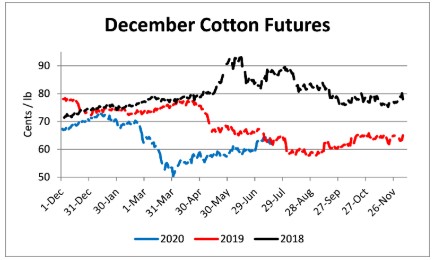
Nationally, the Crop Progress report estimated cotton condition at 44% good-to-excellent and 26% poor-to-very poor; cotton squaring at 63% compared to 47% last week, 56% last year, and a 5-year average of 62%; and cotton setting bolls at 18% compared to 13% last week, 18% last year, and a 5-year average of 21%. In Tennessee, cotton condition was estimated at 62% good-to-excellent and 11% poor-to-very poor; cotton squaring at 69% compared to 52% last week, 60% last year, and a 5-year average of 73%; and cotton setting bolls at 20% compared to 16% last week, 11% last year, and a 5-year average of 18%. December 2020 cotton futures closed at 61.94, down 2.37 cents since last Friday. For the week, December 2020 cotton futures traded between 61.68 and 64.21 cents. Dec/Mar and Dec/Dec cotton futures spreads were 0.69 cent and 0.5 cent. Downside price protection could be obtained by purchasing a 62 cent December 2020 Put Option costing 2.76 cents establishing a 59.24 cent futures floor. March 2021 cotton futures closed at 62.63 cents, down 2.2 cents since last Friday. December 2021 cotton futures closed at 62.44 cents, down 1.6 cents since last Friday.
Wheat
Wheat net sales reported by exporters were up compared to last week with net sales of 28.1 million bushels for the 2020/21 marketing year. Exports for the same time period were up 56% from last week at 23.6 million bushels. Wheat export sales were 32% of the USDA estimated total annual exports for the 2020/21 marketing year (June 1 to May 31), compared to the previous 5-year average of 33%.
Wheat | Sep 20 | Change | Jul 21 | Change |
Price | $5.34 | $0.00 | $5.43 | $0.05 |
Support | $5.25 | $0.17 | $5.36 | $0.16 |
Resistance | $5.44 | $0.05 | $5.52 | $0.01 |
20 Day MA | $5.06 | $0.09 | $5.23 | $0.05 |
50 Day MA | $5.09 | $0.01 | $5.28 | $0.01 |
100 Day MA | $5.23 | -$0.01 | $5.35 | -$0.01 |
4-Week High | $5.51 | $0.12 | $5.54 | $0.08 |
4-Week Low | $4.71 | $0.00 | $4.96 | $0.00 |
Technical Trend | Up | = | Up | = |
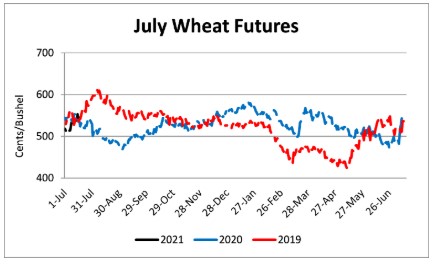
Nationally the Crop Progress report estimated winter wheat harvested at 68% compared to 56% last week, 54% last year, and a 5-year average of 66%; spring wheat condition at 68% good-to-excellent and 8% poor-to-very poor; and spring wheat headed at 80% compared to 63% last week, 72% last year, and a 5-year average of 85%. In Tennessee, winter wheat harvested was estimated at 100% compared to 97% last week and 99% last year. In Tennessee, July 2020 cash contracts ranged from $5.09 to $5.72. September 2020 wheat futures closed at $5.34, unchanged since last Friday. September 2020 wheat futures traded between $5.22 and $5.51 this week. September wheat-to-corn price ratio was 1.60. Sep/Dec and Sep/Jul future spreads were 6 and 9 cents. December 2020 wheat futures closed at $5.40 up 1 cent since last Friday. December wheat-to-corn price ratio was 1.59. July 2021 wheat futures closed at $5.43, up 5 cents since last Friday. Downside price protection could be obtained by purchasing a $5.50 July 2021 Put Option costing 41 cents establishing a $5.09 futures floor.
Source : tennessee.edu