Corn | Sep 20 | Change | Dec 20 | Change |
Price | $3.37 | -$0.06 | $3.44 | -$0.09 |
Support | $3.32 | -$0.04 | $3.32 | -$0.14 |
Resistance | $3.59 | $0.02 | $3.66 | $0.00 |
20 Day MA | $3.36 | $0.03 | $3.44 | $0.02 |
50 Day MA | $3.30 | $0.02 | $3.39 | $0.02 |
100 Day MA | $3.42 | -$0.02 | $3.50 | -$0.02 |
4-Week High | $3.55 | $0.02 | $3.63 | $0.00 |
4-Week Low | $3.15 | $0.00 | $3.22 | $0.00 |
Technical Trend | Up | = | Up | = |
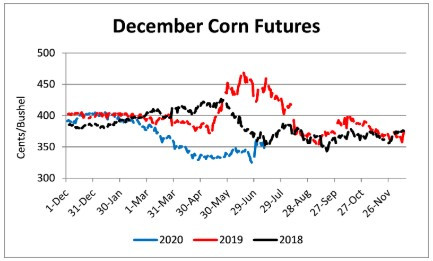
Nationally the Crop Progress report estimated corn condition at 71% good-to-excellent and 6% poor-to-very poor; and corn silking at 10% compared to 4% last week, 7% last year, and a 5-year average of 16%. In Tennessee, the Crop Progress report estimated corn condition at 73% good-to-excellent and 4% poor-to-very poor; corn silking at 43% compared to 17% last week, 62% last year, and a 5-year average of 64%; and corn dough at 6% compared to 14% last year and a 5-year average of 8%. In Tennessee, new crop cash corn contracts ranged from $3.27 to $3.65. December 2020 corn futures closed at $3.44, down 9 cents since last Friday. Downside price protection could be obtained by purchasing a $3.50 December 2020 Put Option costing 21 cents establishing a $3.29 futures floor. March 2021 corn futures closed at $3.55, down 10 cents since last Friday.
Soybeans
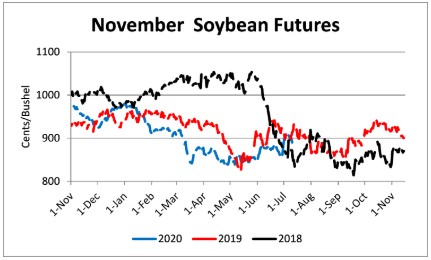
Net sales reported by exporters were up compared to last week with net sales of 35.0 million bushels for the 2019/20 marketing year and 14.0 million bushels for the 2020/21 marketing year. Exports for the same period were up 20% compared to last week at 17.2 million bushels. Soybean export sales and commitments were 102% of the USDA estimated total annual exports for the 2019/20 marketing year (September 1 to August 31), compared to the previous 5-year average of 102%. Average soybean basis weakened at Memphis and Northwest Barge Points and strengthened at Upper-middle and Northwest Tennessee. Basis ranged from 8 under to 34 over the August futures contract at elevators and barge points. Average basis at the end of the week was 19 over the August futures contract. August 2020 soybean futures closed at $8.87, down 4 cents since last Friday. For the week, August 2020 soybean futures traded between $8.83 and $9.04. Aug/Sep and Aug/Nov future spreads were -2 and 3 cents. September 2020 soybean futures closed at $8.85, down 5 cents since last Friday. August/September soybean-to-corn price ratio was 2.63 at the end of the week.
Soybeans | Aug 20 | Change | Nov 20 | Change |
Price | $8.87 | -$0.04 | $8.90 | -$0.06 |
Support | $8.70 | -$0.15 | $8.70 | -$0.20 |
Resistance | $9.09 | $0.11 | $9.15 | $0.10 |
20 Day MA | $8.78 | $0.07 | $8.82 | $0.05 |
50 Day MA | $8.61 | $0.05 | $8.67 | $0.06 |
100 Day MA | $8.67 | -$0.01 | $8.71 | -$0.01 |
4-Week High | $9.04 | $0.09 | $9.12 | $0.09 |
4-Week Low | $8.56 | $0.03 | $8.56 | $0.00 |
Technical Trend | Strong Up | = | Strong Up | = |
Nationally the Crop Progress report estimated soybean condition at 71% good-to-excellent and 5% poor-to-very poor; soybeans blooming at 31% compared to 14% last week, 8% last year, and a 5-year average of 24%; and soybeans setting pods at 2% compared to 1% last year and a 5-year average of 4%. In Tennessee, soybean condition was estimated at 73% good-to-excellent and 5% poor-to-very poor; soybeans planted at 98% compared to 92% last week, 96% last year, and a 5-year average of 95%; soybeans emerged at 91% compared to 82% last week, 89% last year, and a 5-year average of 90%; soybeans blooming at 19% compared to 8% last week, 22% last year, and a 5-year average of 24%; and soybeans setting pods at 2% compared to 2% last year and a 5-year average of 3%. In Tennessee, new crop soybean cash contracts ranged from $8.81 to $9.28. Nov/Dec 2020 soybean-to-corn price ratio was 2.59 at the end of the week. November 2020 soybean futures closed at $8.90, down 6 cents since last Friday. Downside price protection could be achieved by purchasing a $9.00 November 2020 Put Option which would cost 34 cents and set an $8.66 futures floor.
Cotton
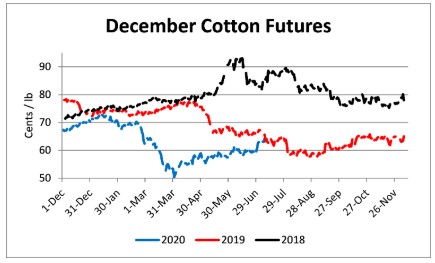
Net sales reported by exporters were down compared to last week with net sales of 43,800 bales for the 2019/20 marketing year and 6,700 bales for the 2020/21 marketing year. Exports for the same time period were up 19% compared to last week at 329,300 bales. Upland cotton export sales were 122% of the USDA estimated total annual exports for the 2019/20 marketing year (August 1 to July 31), compared to the previous 5-year average of 108%. Delta upland cotton spot price quotes for July 9 were 61.84 cents/lb (41-4-34) and 64.09 cents/lb (31-3-35). Adjusted World Price (AWP) increased 1.35 cents to 51.48 cents.
Cotton | Dec 20 | Change | Mar 21 | Change |
Price | 64.31 | 1.36 | 64.83 | 1.16 |
Support | 62.57 | 0.51 | 63.15 | 0.37 |
Resistance | 65.47 | 2.05 | 65.89 | 1.75 |
20 Day MA | 60.91 | 0.87 | 61.55 | 0.88 |
50 Day MA | 59.36 | 0.58 | 60.09 | 0.58 |
100 Day MA | 59.07 | -0.28 | 59.91 | -0.29 |
4-Week High | 64.90 | 1.92 | 65.39 | 1.70 |
4-Week Low | 57.75 | 0.00 | 58.37 | 0.00 |
Technical Trend | Strong Up | = | Strong Up | = |
Nationally, the Crop Progress report estimated cotton condition at 43% good-to-excellent and 23% poor-to-very poor; cotton squaring at 47% compared to 35% last week, 44% last year, and a 5-year average of 48%; and cotton setting bolls at 13% compared to 9% last week, 11% last year, and a 5-year average of 13%. In Tennessee, cotton condition was estimated at 62% good-to-excellent and 11% poor-to-very poor; cotton squaring at 52% compared to 29% last week, 51% last year, and a 5-year average of 60%; and cotton setting bolls at 16% compared to 3% last week, 5% last year, and a 5-year average of 8%. December 2020 cotton futures closed at 64.31, up 1.36 cents since last Friday. For the week, December 2020 cotton futures traded between 62.45 and 64.9 cents. Dec/Mar and Dec/Dec cotton futures spreads were -0.27 cent and 0.52 cent. Downside price protection could be obtained by purchasing a 65 cent December 2020 Put Option costing 3.37 cents establishing a 61.63 cent futures floor. March 2021 cotton futures closed at 64.83 cents, up 1.16 cents since last Friday. December 2021 cotton futures closed at 64.83 cents, up 2.07 cents since last Friday.
Wheat
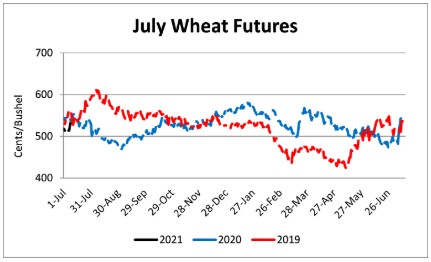
Wheat net sales reported by exporters were down compared to last week with net sales of 12.0 million bushels for the 2020/21 marketing year and 2.8 million bushels for the 2021/22 marketing year. Exports for the same time period were down 19% from last week at 15.1 million bushels. Wheat export sales were 30% of the USDA estimated total annual exports for the 2020/21 marketing year (June 1 to May 31), compared to the previous 5-year average of 31%.
Wheat | Sep 20 | Change | Jul 21 | Change |
Price | $5.34 | $0.42 | $5.38 | $0.25 |
Support | $5.08 | $0.26 | $5.20 | $0.14 |
Resistance | $5.39 | $0.35 | $5.51 | $0.30 |
20 Day MA | $4.97 | $0.00 | $5.18 | -$0.03 |
50 Day MA | $5.08 | -$0.02 | $5.27 | $0.00 |
100 Day MA | $5.24 | -$0.02 | $5.36 | -$0.02 |
4-Week High | $5.39 | $0.07 | $5.46 | -$0.05 |
4-Week Low | $4.71 | $0.00 | $4.96 | $0.00 |
Technical Trend | Up | + | Up | + |
Nationally the Crop Progress report estimated winter wheat condition at 51% good-to-excellent and 17% poor-to-very poor; winter wheat harvested at 56% compared to 41% last week, 42% last year, and a 5-year average of 55%; spring wheat condition at 70% good-to-excellent and 6% poor-to-very poor; and spring wheat headed at 63% compared to 36% last week, 47% last year, and a 5-year average of 68%. In Tennessee, winter wheat mature was estimated at 99% compared to 97% last week; and winter wheat harvest at 97% compared to 88% last week, 96% last year, and a 5-year average of 96%. In Tennessee, July 2020 cash contracts ranged from $4.77 to $5.44. September 2020 wheat futures closed at $5.34, up 42 cents since last Friday. September 2020 wheat futures traded between $4.87 and $5.39 this week. September wheat-to-corn price ratio was 1.58. Sep/Dec and Sep/Jul future spreads were 4 and 5 cents. December 2020 wheat futures closed at $5.39 up 40 cents since last Friday. December wheat-to-corn price ratio was 1.57. July 2021 wheat futures closed at $5.38, up 25 cents since last Friday. Downside price protection could be obtained by purchasing a $5.40 July 2021 Put Option costing 39 cents establishing a $5.01 futures floor.
Source : tennessee.edu