Overview
Corn, soybeans, and wheat were up; cotton was down for the week.
Grains and oilseeds regained some of the recent losses in the futures market. Harvest corn closed the week 10 cents higher than last week’s contract low, at $3.64. November soybeans continued last week’s rally and were up 40 cents from the March 18 contract low. July wheat got back to pre-COVID prices closing up 60 cents, at $5.57, since the March 16 low. Commodity prices remain very unpredictable due the COVID-19 outbreak, so don’t rule out a potential retest of contract lows.
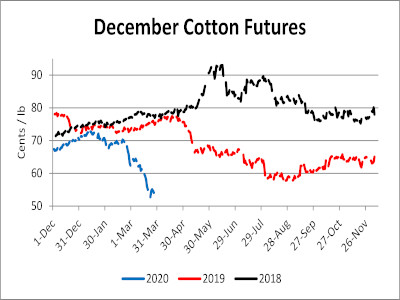
Unlike grains and oilseeds, cotton futures continued to decline. Since the first U.S. case of COVID-19 on January 21, December cotton futures have declined 24.5%, from 70.9 to 53.49 (Friday’s close). Nearby cotton futures are now at its lowest level since April 2009.
Corn shortages in Brazil have pushed prices in that country up to $200/MT in some regions. This is over $5.00 per bushel. The second crop corn harvest should help alleviate some of the domestic demand. The high domestic prices in Brazil, and the recent weakening of the USD, should allow stronger exports from the U.S. (and other countries) were prices are substantially lower. The most recent USDA weekly export sales data, March 13-19, indicated a marketing year high for U.S. corn export sales at over 71 million bushels. Markets are still very uncertain due to COVID-19 but there are some positive indications we could see additional old crop export sales and higher prices in the future.
In Tennessee, new crop cash wheat contracts breached $6. New crop cash contracts for harvest delivery above $6 represent a good starting point to price some of the 2020 winter wheat crop, particularly if limited or no on-farm storage is available.
| Previous | Current | Change |
USD Index | 103.48 | 98.50 | -4.98 |
Crude Oil | 23.57 | 21.69 | -1.88 |
DJIA | 19,161 | 22,174 | 3,013 |
Corn
Ethanol production for the week ending March 20 was 1.005 million barrels per day, down 30,000 barrels from the previous week. Ethanol stocks were 24.140 million barrels, down 0.458 million barrels compare to last week. Corn net sales reported by exporters for March 13-19 were up compared to last week with net sales of 71.4 million bushels (marketing year high) for the 2019/20 marketing year and 3.3 million bushels for the 2020/21 marketing year. Exports for the same time period were down 13% from last week at 33.3 million bushels. Corn export sales and commitments were 70% of the USDA estimated total exports for the 2019/20 marketing year (September 1 to August 31) compared to the previous 5-year average of 80%. Across Tennessee, average corn basis (cash price-nearby futures price) strengthened at Memphis and weakened at Northwest Barge Points, Northwest, and Upper-middle Tennessee. Overall, basis for the week ranged from 3 under to 26 over, with an average of 9 over the May futures at elevators and barge points. May 2020 corn futures closed at $3.46, up 3 cents since last Friday. For the week, May 2020 corn futures traded between $3.38 and $3.52. May/Jul and May/Dec future spreads were 5 and 18 cents. July 2020 corn futures closed at $3.51, up 2 cents since last Friday.
Corn | May 20 | Change | Dec 20 | Change |
Price | $3.46 | $0.03 | $3.64 | $0.01 |
Support | $3.41 | $0.14 | $3.62 | $0.12 |
Resistance | $3.52 | -$0.11 | $3.70 | -$0.07 |
20 Day MA | $3.60 | -$0.07 | $3.71 | -$0.04 |
50 Day MA | $3.75 | -$0.05 | $3.83 | -$0.04 |
100 Day MA | $3.82 | -$0.03 | $3.90 | -$0.02 |
4-Week High | $3.86 | $0.00 | $3.86 | -$0.03 |
4-Week Low | $3.32 | $0.00 | $3.55 | $0.00 |
Technical Trend | Strong Down | = | Strong Down | = |
In Tennessee, new crop cash corn contracts ranged from $3.39 to $3.67. December 2020 corn futures closed at $3.64, up 1 cent since last Friday. Downside price protection could be obtained by purchasing a $3.70 December 2020 Put Option costing 29 cents establishing a $3.41 futures floor.

Soybeans
Net sales reported by exporters were up compared to last week with net sales of 33.2 million bushels for the 2019/20 marketing year and 0.02 million bushels for the 2020/21 marketing year. Exports for the same period were up 26% compared to last week at 22.3 million bushels. Soybean export sales and commitments were 72% of the USDA estimated total annual exports for the 2019/20 marketing year (September 1 to August 31), compared to the previous 5-year average of 91%. Average soybean basis weakened at Northwest Barge Points and strengthened at Memphis, Northwest, and Upper-middle Tennessee. Basis ranged from 15 under to 31 over the May futures contract at elevators and barge points. Average basis at the end of the week was 9 over the May futures contract. May 2020 soybean futures closed at $8.81, up 19 cents since last Friday. For the week, May 2020 soybean futures traded between $8.58 and $8.97. May/Jul and May/Nov future spreads were 4 and -5 cents. July 2020 soybean futures closed at $8.85, up 21 cents since last Friday. May soybean-to-corn price ratio was 2.55 at the end of the week.
Soybeans | May 20 | Change | Nov 20 | Change |
Price | $8.81 | $0.19 | $8.76 | $0.16 |
Support | $8.65 | $0.27 | $8.66 | $0.26 |
Resistance | $8.91 | $0.15 | $8.87 | $0.11 |
20 Day MA | $8.71 | -$0.01 | $8.79 | -$0.09 |
50 Day MA | $8.90 | -$0.07 | $9.06 | -$0.10 |
100 Day MA | $9.16 | -$0.03 | $9.32 | -$0.04 |
4-Week High | $9.12 | $0.00 | $9.23 | -$0.01 |
4-Week Low | $8.21 | $0.00 | $8.36 | $0.00 |
Technical Trend | Down | + | Down | + |
In Tennessee, new crop soybean cash contracts ranged from $8.34 to $8.89. Nov/Dec 2020 soybean-to-corn price ratio was 2.41 at the end of the week. November 2020 soybean futures closed at $8.76, up 16 cents since last Friday. Downside price protection could be achieved by purchasing an $8.80 November 2020 Put Option which would cost 43 cents and set an $8.37 futures floor.

Cotton
Net sales reported by exporters were down compared to last week with net sales of 277,100 bales for the 2019/20 marketing year and 120,100 bales for the 2020/21 marketing year. Exports for the same time period were up 5% compared to last week at 386,800 bales. Upland cotton export sales were 99% of the USDA estimated total annual exports for the 2019/20 marketing year (August 1 to July 31), compared to the previous 5-year average of 92%. Delta upland cotton spot price quotes for March 26 were 49.03 cents/lb (41-4-34) and 51.28 cents/lb (31-3-35). Adjusted World Price (AWP) decreased 4.96 cents to 44.99 cents. May 2020 cotton futures closed at 51.33 cents, down 2.35 cents since last Friday. For the week, May 2020 cotton futures traded between 50.68 and 54.87 cents. May/Jul and May/Dec cotton futures spreads were -0.05 cents and 2.16 cents. July 2020 cotton futures closed at 51.28 cents, down 2.46 cents since last Friday.
Cotton | May 20 | Change | Dec 20 | Change |
Price | 51.33 | -2.35 | 53.49 | -1.54 |
Support | 49.76 | -1.50 | 52.30 | -0.68 |
Resistance | 54.10 | -3.46 | 55.66 | -2.64 |
20 Day MA | 58.21 | -3.04 | 59.39 | -2.79 |
50 Day MA | 64.48 | -1.97 | 65.24 | -1.83 |
100 Day MA | 66.36 | -0.71 | 67.13 | -0.67 |
4-Week High | 65.07 | -4.29 | 65.80 | -4.15 |
4-Week Low | 50.68 | -2.52 | 51.90 | -2.72 |
Technical Trend | Strong Down | = | Strong Down | = |
December 2020 cotton futures closed at 53.49, down 1.54 cents since last Friday. Downside price protection could be obtained by purchasing a 54 cent December 2020 Put Option costing 5.14 cents establishing a 48.86 cent futures floor.

Wheat
Wheat net sales reported by exporters were up compared to last week with net sales of 27.2 million bushels for the 2019/20 marketing year and 13.5 million bushels for the 2020/21 marketing year. Exports for the same time period were up 12% from last week at 15.3 million bushels. Wheat export sales were 91% of the USDA estimated total annual exports for the 2019/20 marketing year (June 1 to May 31), compared to the previous 5-year average of 99%. May 2020 wheat futures closed at $5.71, up 32 cents since last Friday. May 2020 wheat futures traded between $5.37 and $5.87 this week. May wheat-to-corn price ratio was 1.65. May/Jul and May/Sep future spreads were -14 and -15 cents.
Wheat | May 20 | Change | Jul 20 | Change |
Price | $5.71 | $0.32 | $5.57 | $0.22 |
Support | $5.50 | $0.54 | $5.43 | $0.19 |
Resistance | $5.97 | $0.37 | $5.74 | $0.27 |
20 Day MA | $5.29 | $0.09 | $5.27 | $0.07 |
50 Day MA | $5.45 | $0.00 | $5.44 | -$0.01 |
100 Day MA | $5.42 | $0.03 | $5.42 | $0.01 |
4-Week High | $5.87 | $0.19 | $5.71 | $0.04 |
4-Week Low | $4.91 | $0.00 | $4.94 | $0.00 |
Technical Trend | Up | = | Up | + |
In Tennessee, June/July 2020 cash contracts ranged from $5.55 to $6.03. July 2020 wheat futures closed at $5.57, up 22 cents since last Friday. Downside price protection could be obtained by purchasing a $5.60 July 2020 Put Option costing 30 cents establishing a $5.30 futures floor. July wheat-to-corn price ratio was 1.59. September 2020 wheat futures closed at $5.56, up 18 cents since last Friday.

Source : tennessee.edu