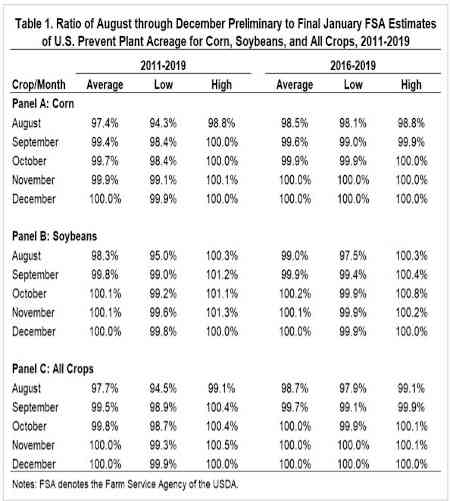
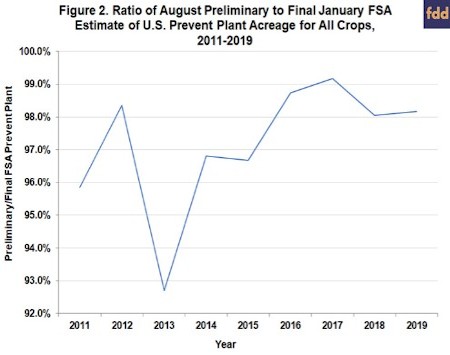
There is some variation in the relationship between preliminary and final prevented plant acreage that is obscured by the averages over 2011-2019 in Table 1. As an example, Figure 2 presents the yearly ratios for corn in August. Two things stand out. First, there was a sharp drop in reporting in 2013. Second, there is overall an upward trend in reporting for August over time. These same trends are found in soybeans and all crops. Consequently, we also present statistics for the ratio of preliminary and final prevented planting in Table 2 only for the last four years, 2016-2019. This increases the average ratio for corn, soybeans, and all crops in August to 98.5, 99.0, and 98.7 percent, respectively.
We can now apply the relationships between preliminary and final prevented plant acreage to the August 2020 report issued by the FSA to estimate final prevented plant acreage. The computations are as follows:
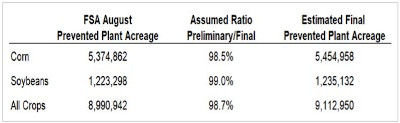
Given the assumed ratios, the estimated increase in prevented plant acreage from the August preliminary report to the final are not very large, about 80,000 acres for corn, 12,000 acres for soybeans, and 122,000 acres for all crops. However, as noted earlier, the July 15th reporting deadline was effectively waived for 30 days this year due to the COVID-19 pandemic. This may delay reporting compared to the pattern of recent years. To provide some perspective, we redo the computations but assume the lowest reporting ratio for all crops, 94.5 percent that occurred in August 2013. At this reporting level for August 2020, we estimate final total prevented plant acreage for all crops would be 520,000 acres higher than the preliminary August estimate.
Implications
Prevented plant acreage can be an important consideration when estimating U.S. planted acreage for corn, soybeans, and all crops. The Farm Service Agency (FSA) of the USDA issues preliminary estimates of prevented plant acreage on a monthly basis from August through December. Final figures are released in January. We estimate the relationship between the preliminary and final estimates and find that all but a very small slice of prevented plant acreage for corn, soybeans, and all crops is reported in August. For example, over 2011-2019 the average ratio of preliminary to final prevented plant acreage for corn, soybeans, and all crops is 97.4, 98.3, and 97.7 percent, respectively. The normal historical relationships suggest minimal increase in the preliminary August prevent plant acreage for 2020 released earlier this month. However, some reporting delays are likely due to the COVID-19 pandemic and this could result in larger than normal increases in prevented plant estimates as additional monthly reports are released.
Source : illinois.edu