For example, if one area of the high tunnel stays wetter than another, collect samples from plants in that area separate from other areas. Or, if you are growing more than one cultivar in the tunnel, collect different samples for each cultivar being grown.
Place your sample in a paper bag and send it to a lab for analysis. A mistake that is sometimes made is putting the sample in a plastic bag. Doing this can cause moisture to accumulate around the sample and it can start to degrade or rot. When this happens the sample may not be useable. The leaf tissue analysis interpretation provided here is from Penn State University’s Agricultural Analytical Services Laboratory.
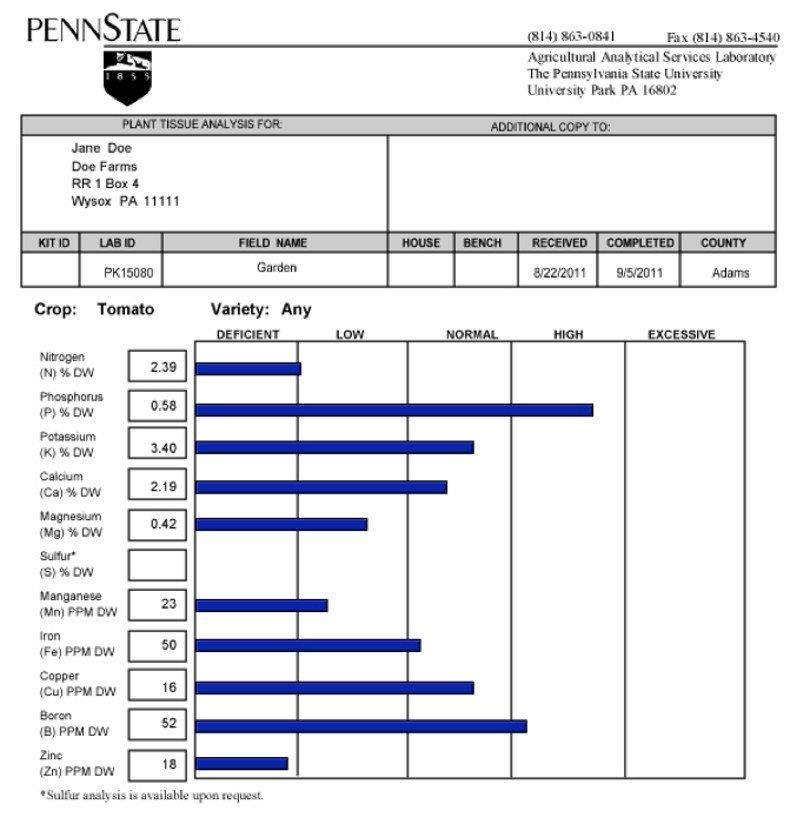
Figure 2. An example tissue analysis report from Penn State University’s Agricultural Analytical Services Laboratory.
Nutrient concentrations are categorized as deficient, low, normal, high, or excessive.
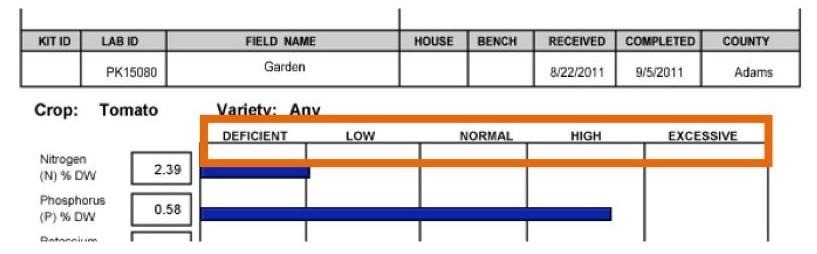
Figure 3. Nutrient concentration categories are deficient, low, normal, high, and excessive.
Normal means that the tissue has a sufficient concentration of the nutrient and no corrective action is needed. A high concentration usually does not affect plant growth or yield, but can lead to a problem if it reaches the excessive category. Monitor nutrient concentrations in the high category to avoid them moving into the excessive range. An excessive concentration means that the nutrient may have reached toxic levels where plant growth, yield, and quality are reduced. Review your nutrient management plan in this case and reduce the amount of the excessive nutrient applied. Deficient or low indicates that the nutrient is below sufficient concentrations and is likely limiting the crop’s potential. Concentrations in the deficient category mean that crop response to adding the nutrient is medium and in the low category crop response to adding the nutrient is high.
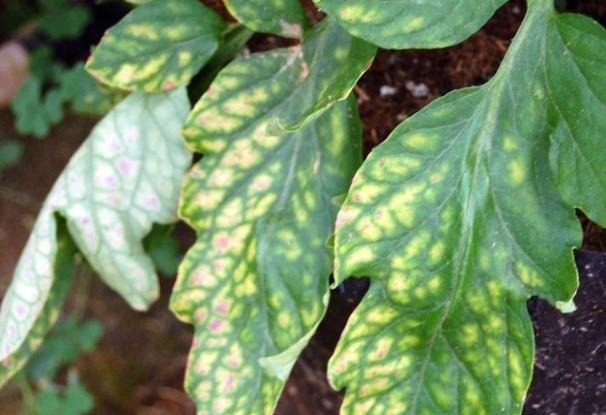
Figure 4. Magnesium deficiency is commonly observed on the lower leaves of tomatoes in high tunnels. Photo: Tom Ford, Penn State
The table below is from Plant Tissue Analysis and Interpretation for Vegetable Crops in Florida by G.J. Hochmuth, D. Maynard, C. Vavrina, E. Hanlon, and E. Simonne and provides a starting point for adding nutrients when tissue concentrations are in the deficient or low categories. Testing again in about 2 weeks can let you know if the actions you take now are working.
Table 1. The starting point for adding nutrients when tissue concentrations are in the deficient or low categories.
| Nutrient | Fertilizer | Method of Application | Rate (lb/acre) | Rate (lb/1000 ft2) |
|---|
| Nitrogen (N) | Ammonium nitrate | Topdress, sidedress, fertigation | 30–40 | 0.69–0.92 |
| Nitrogen (N) | Calcium nitrate | Topdress, sidedress, fertigation | 31–40 | 0.69–0.93 |
| Phosphorus (P2O5) | Ammonium phosphates | Topdress, sidedress, fertigation | 20 | 0.46 |
| Phosphorus (P2O5) | Triple, normal | Topdress, sidedress | 20 | 0.46 |
| Phosphorus (P2O5) | Phosphoric acid | Sidedress, fertigation | 20 | 0.46 |
| Potassium (K2O) | Potassium chloride | Topdress, sidedress, fertigation | 30 | 0.69 |
| Potassium (K2O) | Potassium nitrate | Topdress, sidedress, fertigation | 30 | 0.69 |
| Calcium (Ca) | Calcium nitrate | Topdress, sidedress, fertigation | 30 | 0.69 |
| Calcium (Ca) | Calcium chloride | Fertigation | 30 | 0.69 |
| Magnesium (Mg) | Magnesium sulfate | Topdress, sidedress, fertigation | 20 | 0.46 |
| Magnesium (Mg) | Magnesium nitrate | Fertigation | 20 | 0.46 |
| Magnesium (Mg) | Potassium magnesium sulfate | Topdress, sidedress | 10 | 0.23 |
| Boron (B) | Borax | Fertigation, foliar | 0.1–0.2 | 0.0023–0.0046 |
| Copper (Cu) | Copper sulfate | Fertigation, foliar | 0.1–0.3 | 0.0023–0.0046 |
| Iron (Fe) | Ferrous sulfate | Fertigation, foliar | 0.2–0.5 | 0.0046–0.11 |
| Iron (Fe) | Chelated iron | Fertigation, foliar | 0.2–0.6 | 0.0046–0.11 |
| Manganese (Mn) | Manganous sulfate | Fertigation, foliar | 0.5–1.0 | 0.11–0.023 |
| Molybdenum (Mo) | Sodium molybdate | Fertigation, foliar | 0.01–0.05 | 0.0023–0.011 |
| Zinc (Zn) | Zinc sulfate | Fertigation, foliar | 0.1–0.2 | 0.0023–0.0046 |
| Zinc (Zn) | Chelated zinc | Fertigation, foliar | 0.1–0.3 | 0.0023–0.0047 |
HS964/EP081: Plant Tissue Analysis and Interpretation for Vegetable Crops in Florida (ufl.edu)
Source : psu.edu