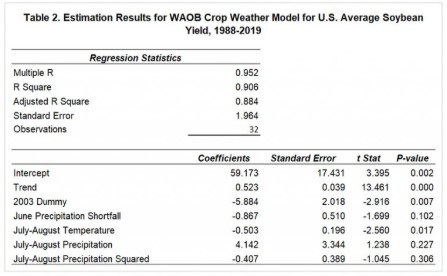
The next step was to update the crop weather model estimates through 2019. Our conversations with WAOB staff indicate that an additional variable was added to the soybean model since the original estimation presented in Westcott and Jewison (2013). In particular, a dummy variable was added for 2003 to represent the yield loss due to aphids that year. The estimation results including this 2003 dummy variable are shown in Table 2. Even with the addition of the dummy variable, the coefficient estimates for the other variables over 1988-2019 do not differ greatly from those over 1988-2012 shown in Table 1, perhaps with the exception of the June shortfall variable. The coefficient estimates shown in Table 2 are presumably close to those used by the WAOB to generate the yield projection of 49.8 bushels per acre released in the May 2020 WASDE report. We now turn to the task of replicating this yield forecast using the estimation results shown in Table 2.
It would seem straightforward to estimate a 2020 soybean yield using the WAOB crop weather model. Simply take the coefficient variables found in Table 2 times the sample averages for each variable, sum the results, and generate the projection. Note that in the case of the June shortfall variable, the sample average is not literally zero but this zero is typically assumed unless a severe drought like 1988 or 2012 is expected. This procedure generates the following 2020 yield forecast:
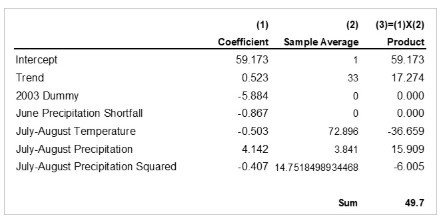
The computed forecast is indeed very close the published WASDE forecast in May and June of this year of 49.8 bushels. Regardless, this is not exactly not how the WAOB computes its soybean projection.
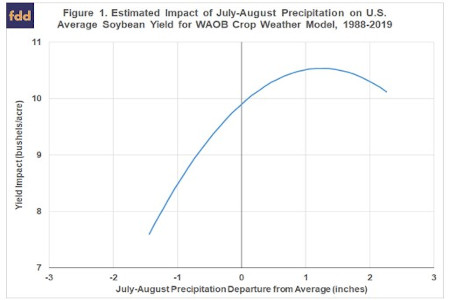
A complication is introduced because the July-August precipitation variable is specified as a non-linear quadratic function. Figure 1 plots this estimated relationship using the coefficients presented in Table 2. For convenience, the x-axis is expressed in deviations from the sample average for July-August precipitation. The estimated “hill-shaped” relationship has the important property that the response to July-August average precipitation is asymmetrical. That is, large deviations below average reduce yield more than large deviations above average increase yield. This is the reason that one cannot plug average July-August precipitation into the model when making forecasts. The yield impact of average July-August precipitation, zero in Figure 1, is not the average of all the yield outcomes plotted in the figure. The true average lies somewhere to the left of the zero line because poor July-August weather reduces yield more than good July-August weather helps yield.
There are various methods to account for the non-linear impact of July-August precipitation when making yield projections with the crop weather model. One is to use Monte Carlo simulation, which is what we did last week in a different application of crop weather models (farmdoc daily, June 25, 2020). The WAOB instead determines the one-standard deviation range of July-August precipitation above and below the average, computes the yield prediction for all levels of July precipitation within this range, and then averages the resulting yield predictions. Westcott and Jewison (2013) indicate this procedure reduced the 2013 model yield projection by only 0.09 bushels per acre. They conclude that the soybean yield adjustment is relatively smaller than the similar adjustment for corn because soybean yields are less sensitive to weather conditions. This is a puzzling conclusion looking at Figure 1, which shows that soybean yield response to July-August precipitation is highly non-linear. An alternative explanation is that the particular adjustment procedure used by the WAOB does not account fully for extreme outcomes in the tails of the July-August precipitation distribution, and a larger adjustment will result if this is done.
We attempted to follow the WAOB non-linear adjustment for July-August precipitation as closely as possible. We did this by ranking July-August precipitation from low to high, determining the cutoffs for one-standard deviation above and below the average July-August precipitation, computing model predictions for each observation of July-August precipitation between the cutoffs, and then averaging all the resulting predictions. The revised computation for the 2020 soybean yield is shown below:
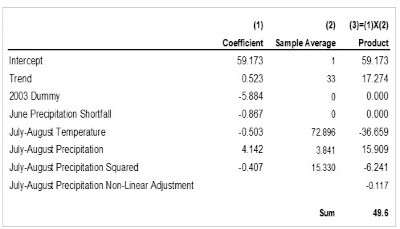
Using these revised procedures we were not able to exactly replicate the published WASDE soybean yield forecast of 49.8 bushels released in May and June of this year. Our underlying data may differ slightly from that used by the WAOB and/or we may not have exactly replicated the non-linear adjustment for July-August precipitation used by the WAOB.
Implications
Soybean yield forecasts contained in May, June, and July WASDE reports from the USDA provide important information to market participants. The forecasts are based on a crop weather model maintained by the World Agricultural Outlook Board (WAOB). The model and procedures used by the WAOB to generate forecasts from the model appear to be poorly understood by many and often confused with later survey-based forecasts released by the National Agricultural Statistics Service (NASS) of the USDA. The WAOB crop weather model for soybeans is actually fairly simple, with trend, a 2003 dummy variable, and three weather variables. We collected the same yield, planting progress, and weather variables as listed in a 2013 report that first presented the WAOB model. Our model estimates using this data were reasonably close to the original estimates found in that report. We then went on to update the model estimates through 2019 and project the 2020 national average yield for soybean. After adjusting for the non-linear response of soybean yield to July precipitation, we were not able to exactly replicate the published forecast of 49.8 bushels per acre. However, our estimate of 49.6 bushels is very closer. We hope this exercise will increase understanding of the WAOB crop weather model and procedures used to generate these important and market-moving soybean yield forecasts.
Source : illinois.edu