Some of the weekly input data sources include:
- Standard Precipitation Index (https://hprcc.unl.edu/maps.php?maps=ACISClimateMaps). This puts climatological perspective to observed moisture and suggests varying deficits/surpluses as a result. The data, similar to many of these data input sources, are available for varying periods of time from 30 days to over a year (Figure 1).
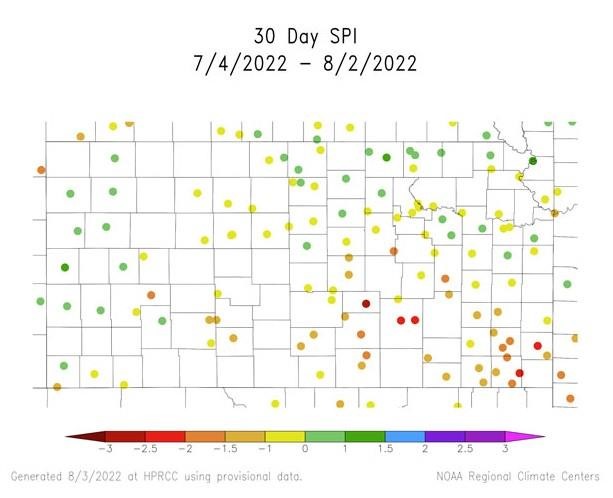
Figure 1. Standard Precipitation Index as viewed by individual climate stations from the High Plains Regional Climate Center.
- Evaporative Drought Demand Index (https://psl.noaa.gov/eddi/). This considers additional inputs, such as wind, that can enhance moisture demands across the region. Especially during the summer, periods of increased wind, combined with hot/dry conditions, can result in rapid evaporation of surface moisture. Increased demand results in additional drought stress. This is updated weekly, but archived data allows for analysis over longer periods of time to consider long-term drought conditions.
- Community Collaborative Rain, Hail and Snow Network (CoCoRaHS) (https://maps.cocorahs.org/). This is a citizen science program that allows the general public to report precipitation in their backyard. The SPI previously only considered climate stations with a thorough history of 30 or more years. These public observers fill in the big data gaps that exist between the climate stations. Most importantly, reports of zero moisture observed help drought monitor authors decide that a particular location didn’t receive moisture and is increasingly dry as a result. Last month, 836 observers across Kansas submitted daily precipitation reports, but there are multiple counties with no reporters. We need more help! You can sign up (and receive a free rain gauge if you promise to report) at http://www.cocorahs.org. You can also view others reports and compare your observations to those from neighboring towns and counties.
- Soil moisture (https://mesonet.ksu.edu/agriculture/soilmoist). Surface soil conditions are critical in determining both moisture availability for plants and moisture demands. Kansas is fortunate enough to have freely available soil moisture that can be viewed both in real-time and with changes from the last seven days to a year. Rapid drops in moisture are monitored as are “flat-lining trends.” Flat-line trends are when soil moisture stops dropping with time and are essentially the lowest possible for that particular location and soil type.
Making an Impact on Drought Monitor Decisions
In addition to the previously mentioned data tools, there is an additional avenue for YOU to report drought impacts for your particular region. Anyone (public, producer, researcher or agency) can also submit Condition Monitoring Observer Reports (CMOR). These reports are easy to make and can reflect the current ‘on-the-ground’ results of the conditions. Even in times of increased moisture, reports help justify conditions in the locale that meteorological data may not reflect. These allow you to report crop stress, livestock impacts, household concerns, surface water conditions and even municipality water supply concerns. It is available in a free, easy to use interface. You can submit reports here: http://go.unl.edu/CMOR and view other’s reports here: http://go.unl.edu/CMORMAP (Figure 2).
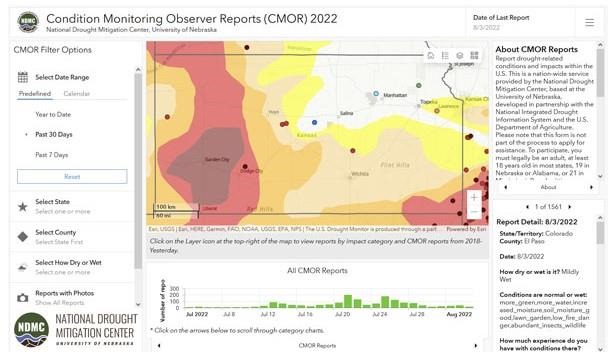
Figure 2. The last 30 days of CMOR reports in Kansas (Source: http://go.unl.edu/CMORMAP).
The resulting data are available to the general public and more importantly, all drought decision makers in the nation. This is the quickest, easiest, and most convenient way to relay how the current drought (or rainfall) has impacted you. These can have substantial impacts on the drought monitor assessment for your locale and provide invaluable data for future research/analysis of water and/or climate status.
The next time you are concerned about your current drought (or wet) conditions, please make a drought report using the CMOR application and provide us your input!
Source : ksu.edu