By Gary Schnitkey and Nick Paulson et.al
Department of Agricultural and Consumer Economics
University of Illinois
By Carl Zulauf
Department of Agricultural, Environmental and Development Economics
Ohio State University
The Farm Service Agency (FSA) released 2019 county yields used in calculating 2019 Agricultural Risk Coverage at the county level (ARC-CO) payments . The primary data source for calculating FSA yields is now crop insurance data from the Risk Management Agency (RMA), a change from prior years in which data from the National Agricultural Statistics Service (NASS) served as the primary source. Herein, we make comparisons of FSA yields to yields from NASS and RMA. We make these comparisons for two reasons. First, NASS yields are released in February, about eight months before FSA releases their yields. We will use these NASS yields to estimate 2020 ARC-CO yields. The comparisons give some idea of the reliability of these ARC-CO estimates made with NASS yields. Second, we provide these comparisons as general information on the difference in yields from the three agencies.
Background
Under the 2018 Farm Bill, farmers and landowners have three choices for receiving commodity title program payments
- Price Loss Coverage (PLC) — a program that makes a payment when the national Market Year Average (MYA) price is below an effective reference price.
- Agricultural Risk Coverage at the county level (ARC-CO) — a program that makes a payment when county revenue is below 86% of the county benchmark revenue.
- Agricultural Risk Coverage at the individual level (ARC-IC) — a program that makes a payment when farm revenue is below 86% of benchmark revenue for a farm.
These were the same three choices as under the 2014 Farm Bill. PLC and ARC-CO could be made on a crop by crop basis on a farm. If ARC-IC was chosen, the entire farm had to be enrolled in ARC-IC. Under the 2018 Farm Bill, farmers and landowners had to make commodity title elections for the 2019 and 2020 cropping years by March 15, 2020. For 2021 and beyond, choices can be made by March 15 in the year of production.
Only ARC-CO requires a county yield for the computation of its payments. The FSA recently released 2019 yields so that 2019 payments can be calculated . At the urging of Midwest farmers, legislation instituting the 2018 Farm Bill changed the primary source of data for FSA county yields. If available and adequate, data from crop insurance made available through RMA is given priority for calculating FSA yields. If RMA data are not available, the state FSA committee will assign yields. Under the 2014 Farm Bill, priority was given to data from NASS yields.
Three agencies in the U.S. Department of Agriculture (USDA) now publish county yields:
- NASS publishes county yields based on statistical sampling methods and are typically released in February of the year following production. Published yields are on a per harvested acre basis. For example, county yields for 2019 were released in February 2020. NASS yields are available through the Quick Stats website maintained by NASS.
- RMA publishes county yields that are used to calculate indemnity payments for area revenue plans such as Supplemental Coverage Option (SCO). RMA county yields for 2019 were released in June 2020. RMA yields are available through a web application on FSA’s website.
- FSA publishes county yields used to calculate ARC-CO payments. These are based on crop insurance data made available from RMA but are not the same as RMA yields used to calculate SCO. FSA yields are not released until the fall of the year following production; 2019 county yields from FSA were released in October 2020. FSA makes yields available in a downloadable Excel spreadsheet in the program data section of their web site here.
NASS county yields typically are less than both RMA and FSA county yields, although this is not always the case. When 2020 NASS yields are released, farmdoc will provide estimates of 2020 ARC-CO payments . NASS yields are adjusted upward to reflect the fact that NASS county yields are usually lower than FSA yields.
The switch in yield preference from NASS as the primary source under the 2014 Farm Bill to RMA under the 2018 Farm Bill does not necessarily impact ARC-CO payments. A benchmark yield based on the five previous yields is used in calculating the ARC-CO guarantee. Using NASS data will typically result in a lower benchmark yield than using RMA data. The corresponding changes should result in roughly the same average payments across all counties, with differences in a particular county’s payment being possible. Issues arose under the 2014 Farm Bill when NASS data were used in calculating guarantees, and then, because of lack of data, RMA data was used in calculating a yield in the revenue calculation. In these cases, ARC-CO payments could be reduced because crop insurance yields typically are higher than NASS yields.
Comparisons of 2019 county yields from NASS, RMA, and FSA yields for Illinois are made in the following sections. A spreadsheet giving the three sets of yields is available here.
2019 County Corn Yields
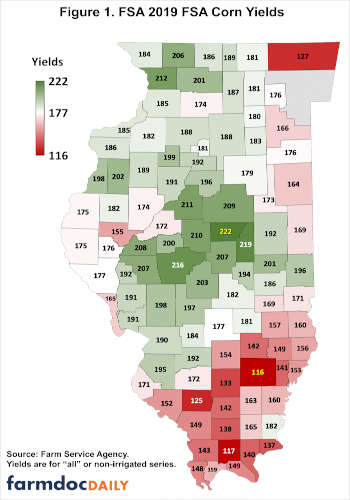
Figure 1 shows 2019 FSA county yields for corn rounded to the whole number. FSA rounds to hundreds when calculating ARC-CO payments. The highest county yields were in central Illinois, with DeWitt county having the highest yield of 222 bushels per acre. Generally, yields in northern Illinois were lower than in central Illinois. Soil productivity differences, and very wet weather, resulted in southern Illinois having lower yields than both northern and central Illinois.
Understanding FSA Yields Used to Calculate 2019 ARC-CO Payments
Yields in Figure 1 are shown for either the “all” or “non-irrigated” series types. In Farm Bill legislation, Congress requires customization of ARC-CO payments for irrigation when irrigation is a significant practice in a county. As a result, FSA either reports one yield per crop for everything grown in the county (“all”) or reports yields for non-irrigated and irrigated crops separately. For corn in Illinois, yields are reported for “all” corn in 65 counties, or 63% of the 102 counties in Illinois (see Figure 2). Yields are reported for non-irrigated and irrigated for the remaining 37 counties (36%).

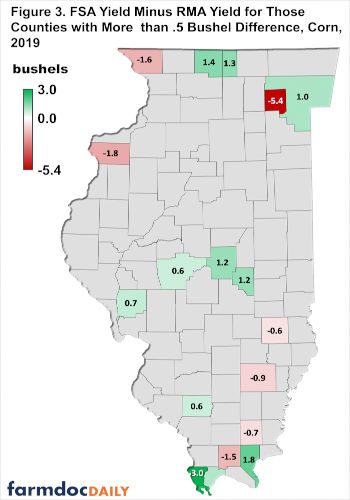
For each county, FSA yields were subtracted from RMA yields. A positive difference means that RSA yields are higher than RMA yields, and vice versa. FSA and RMA yields are relatively close to one another. In 2019, only eighteen counties had yields that varied by more than .5 bushels from one another (see Figure 3). In ten cases, the FSA yield was above the RMA yield. From a geographical perspective, farms with more than .5 difference in yields occur throughout the state.
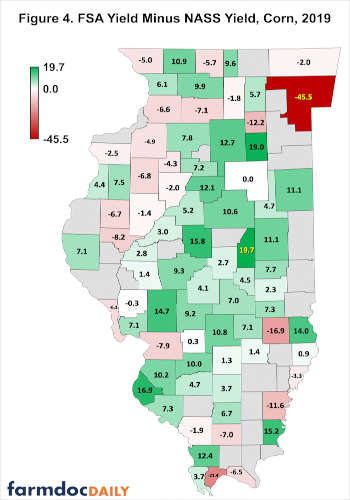
For each county, FSA yields were subtracted from NASS yield. Positive values mean that FSA yields are higher than NASS yields, and vice versa. NASS did not report a yield for 25 counties, or 25% of the counties (see Figure 4). For counties with yields reported, FSA yields averaged 2.6 bushels higher than NASS yields. However, the yield difference ranged considerably across the state. The yield difference was highest for Piatt County at 19.7 bushels per acre. The most negative difference was -46.5 bushels per acre, occurring in Cook County, Chicago’s location. Similar variations have occurred in the past (see farmdoc daily, February 21, 2020). Historical comparisons suggest that variations in one year do not mean that a county will have the same variation in the next year. For example, Piatt County is unlikely to have an FSA yield that is 19.7 bushels higher than the NASS yield in 2020.
2019 County Soybean Yields
Figure 5 shows 2019 FSA county yields for soybeans rounded to the whole number. As with corn, FSA rounds to hundredths when calculating ARC-CO payments. The highest county yields were in central Illinois, with Piatt county having the highest yield of 68 bushels per acre. Yields in northern Illinois were lower than in central Illinois. Soil productivity differences and very wet weather resulted in southern Illinois having lower yields than north and central Illinois.
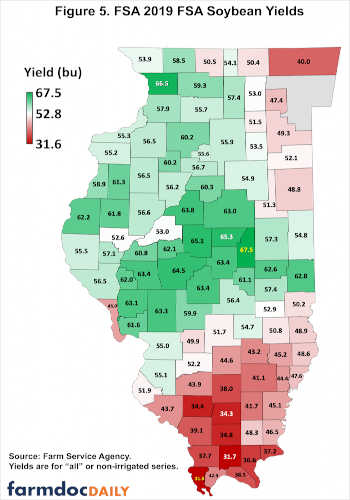
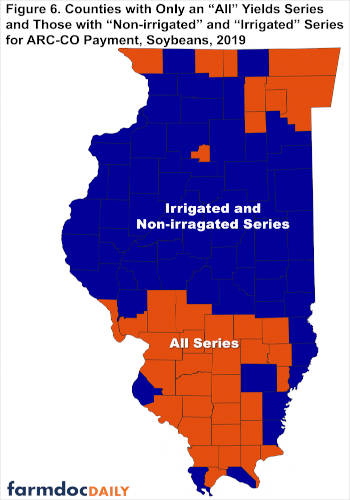
Figure 6 shows the type of series used in determining yields for soybeans. In Illinois, 38 counties (37% of counties) have only an “all” county series. These counties tend to be in the southern and northern parts of the states. Sixty-four counties (63% of counties) have an irrigated and non-irrigated series.
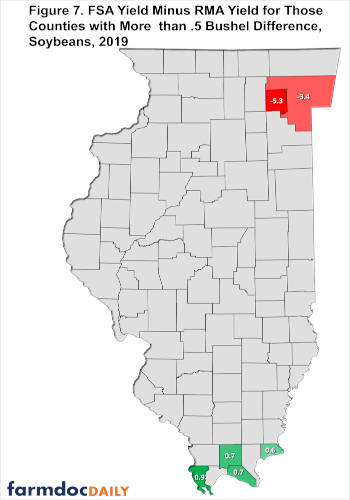
Only six counties have more than a .5 difference between FSA and RMA yields (see Figure 7). Cook and DuPage counties had FSA yields that were below RMA yields. Alexander, Hardin, Johnson, and Massac Counties had FSA yields above RMA yields.
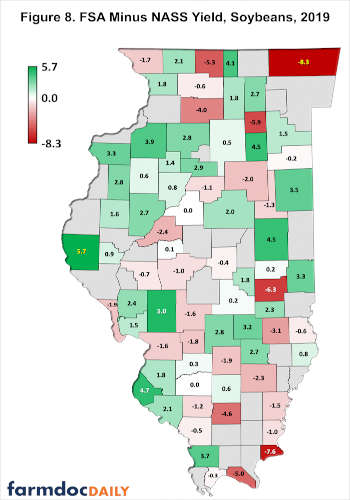
Across all Illinois counties where NASS reported yields, FSA yields were .3 bushels per acre higher than NASS yields (see Figure 8). Similar to corn, there was considerable variability in yields. Adams County FSA yield was 5.7 higher than the NASS yield, the largest in the state. Lake County’s FSA yield was 8.3 bushels per acre lower than the NASS yield, the most negative difference.
Summary
FSA now uses crop insurance data when setting county yields used for determining ARC-CO payments. As a result, FSA and RMA yields are close to one another. FSA yields tend to be higher than NASS yields, but that is not always the case. There is variability in FSA yields from NASS yields. As a result, estimates made using NASS yields in February will be approximate, even after accounting for the average differences between FSA and NASS yields observed over time.
Source : illinois.edu