In addition to China, U.S. low-protein whey exports to South America rose 151% (+1,357 MT) in January. A 25% decline (-2,466 MT) to Southeast Asia and a 69% drop (-1,474 MT) to Japan were the only significant drawbacks to what could have been an even stronger month.
Japan made up for its low-protein whey decline with revitalized WPC80+ demand in January. U.S. exports of high-protein whey to Japan more than doubled to 2,009 MT, marking its largest single-month purchase since September 2023.
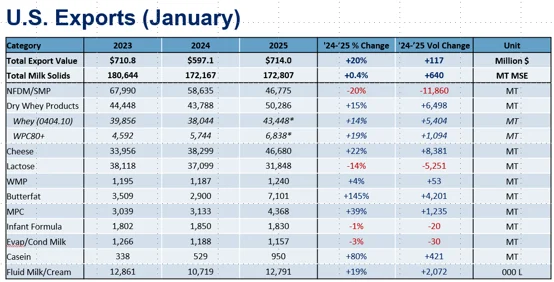
USDEC estimates total U.S. WPC80+ exports rose 19% (+1,094 MT) in January after adjusting for the China misclassification.
Vibrant global butterfat demand and favorable U.S. pricing continue to drive U.S. butter and anhydrous milkfat (AMF) exports. YOY U.S. butter shipments rose 41% (+927 MT) while AMF sales jumped more than six-fold (+3,274 MT). (See below for more on butter.)
As for the decliners, NFDM/SMP recorded its second straight month with volume less than 50,000 MT, which, as noted last month, was a benchmark U.S. suppliers had not crossed since mid-2019. Weak U.S. NFDM/SMP production (at times driving elevated U.S. prices) continues to hamstring U.S. opportunity in global milk powder markets, particularly in Asia.
Total January U.S. NFDM/SMP exports dropped 20% (-11,860 MT). While YOY NFDM/SMP exports to Mexico bounced back (+2%, +574 MT) after two negative months, shipments to other key destinations floundered, Southeast Asia in particular. (For more NFDM/SMP, see below).
Butterfat exports surge in January
In the final months of 2024, U.S. butterfat began to boast a price advantage over other international suppliers. While significant domestic consumption and incongruent standards traditionally prevent the U.S. from being a major milkfat supplier to the world, an increasing price advantage is supporting growing export volume in the near term. We’ve been in similar situations before, but the large price gap leaves some wondering if U.S. exporters can find a way to keep the growth going.
In January, many did just that as U.S. butterfat exports surged 145% year over year (+4,201 MT). The 7,101 MT of butterfat sent abroad marked the largest volume exported in any month since 2014. Butter exports were 41% (+927 MT) larger than last January, recording strong gains across the globe but especially to Canada (+19%, +300 MT), Central America and the Caribbean (+103%, +211 MT), and the Middle East/North Africa (MENA) (+776%, +204 MT).
However, even more impressive growth came from AMF exports, which soared to 3,897 MT in January. It is the highest volume the U.S. has ever shipped in a single month and represents a whopping 525% (+3,274 MT) increase compared to the same month last year. Most of the AMF headed to neighboring Canada (+239%, +1,246 MT) and Mexico (+1,598%, +1,126 MT), perhaps as buyers attempted to stock up prior to the potential implementation of tariffs. MENA and Central America and the Caribbean also increased their purchases by 522 MT and 288 MT, respectively.
Since January exports were booked, the gap between U.S. and international prices has widened. Ample cream supplies and heavy butter stocks have put persistent, downward pressure on the CME spot price for butter, while tighter supplies have kept prices in Europe and Oceania at multiyear highs. Currently, U.S. butter prices hold more than a 30% price advantage against alternative suppliers, after adjusting for fat content. With such a tremendous price advantage and plentiful product available, it seems plausible that U.S. exporters could seize the moment, leading to additional butterfat exports in the coming months.
Cheese exports embrace geographic diversity
U.S. cheese exports enjoyed another strong month in January, with volumes rising to 46,680 MT, up 22% (+8,381 MT) from last year and posting the strongest result ever recorded for the month. Shipments of cheese have now bested prior-year levels for 13 consecutive months, providing a critical boost to overall exports and an essential outlet for U.S. cheese production in the face of tepid domestic utilization.
For many months, insatiable demand from Mexico has been the primary driver of strong U.S. exports with sales rising to record-high levels in 2024. Indeed, Mexico remains the single-largest market for U.S. cheese with exports in January rising to a monthly record of 12,829 MT. However, this represented only a modest 70 MT (+1%) increase compared to the same month last year. Instead, the bulk of the increase in January’s cheese export growth was fueled by alternative destinations.
Asia took center stage in January as cheese exports to Japan soared by 59% (+2,133 MT), posting the strongest volume since June 2014 as U.S. recaptured market share. Not to be left behind, exports to South Korea also jumped by 34% (+1,360 MT). Shipments to Southeast Asia rose (+67%, +845 MT) due especially to increased demand for cheddar.
Demand improvements were not limited to Asia, however, as surging cheddar demand also drove gains in cheese exports to MENA where volumes jumped by 93% (+1,743 MT) in January. The bulk of the increase came from Bahrain, where cheese exports grew by a factor of 20 (+1,122 MT). Strong performance in Central America and the Caribbean (+14%, +1,037 MT) and Oceania (+21%, +587 MT) further contributed to export strength.
While potential tariff complications have muddied the outlook, the increased diversity across cheese export destinations is encouraging, particularly as cheese production in the U.S. continues to expand.
NFDM exports continue to struggle
U.S. NFDM/SMP trade continued to trend lower as we moved into the new year, with January exports down 20% (-11,860 MT) YOY. Exports to Southeast Asia were especially weak—down 42% (-7,519 MT). MENA (-90%, -3,158 MT) and Japan (-72%, -1,470 MT) both saw weaker volume in January as well although compared to very strong volumes in January 2024.
January’s weakness was largely driven by high U.S. prices. Throughout Q4, U.S. NFDM was priced well above the world market—roughly 10% (+267/MT) higher than the EU and New Zealand. For reference, through the first three quarters of 2024, U.S. NFDM averaged just 0.1% ($3/MT) above world prices. The Q4 price premium leading up to January depressed demand for U.S. product and contributed to the weaker exports. The primary reason for the higher price was weaker production. U.S. NFDM/SMP production in 2024 was down 14%, which kept supplies tight and prices supported.
Click here to see more...