Cleaning Trial Results
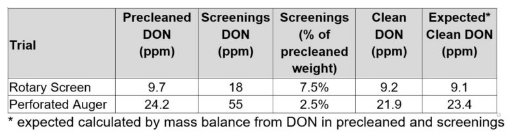
Both trials involved corn that was relatively high testing for DON (Table 1), with screenings testing much higher than precleaned corn. Weight of screenings removed varied. While this may have been influenced by differences in cleaners, the precleaned corn used in the rotary screen trial was from the core of a grain bin and much higher than normal for fines. Reductions in DON ranged 0.5 to 2.0 ppm, which for these samples was not enough to improve marketability.
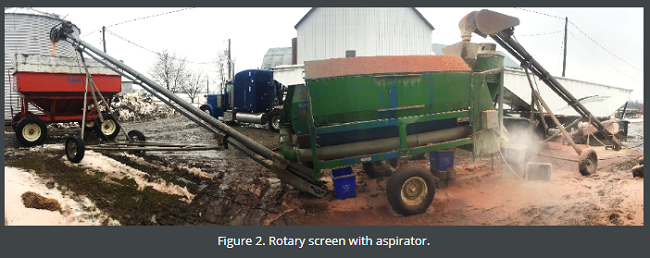
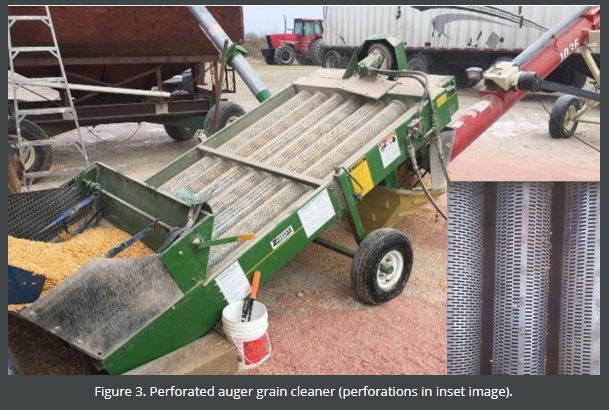
Table 1. DON levels for precleaned, screenings and clean corn streams, as well as screening weights, and expected DON levels for rotary screen and perforated auger cleaning trials.
Why Didn’t We See Greater DON Reductions for Cleaning?
In these trials, cleaning by size did a good job of removing fines, broken and very small kernels and cob. While these screenings have much greater DON concentrations than the grain, they were generally a small percentage of the total mass so overall reductions tended to be small. This was evident in Dr. Schaafsma’s earlier work as well (Figure 1).
There were also visibly infected kernels that were too large to be screened out that remained in the clean stream. These appear as what otherwise would have been normal sized kernels, but were off-colour, visibly infected, under-filled and lighter weight.
How Much DON Reduction Should We Expect?
We were disappointed DON levels did not drop more, but these results align with the laws of mass balance where the amount of DON remaining in the clean corn is the difference of the initial amount of DON less DON removed in the screenings. We can estimate our expected clean DON concentrations by removing the amount of DON removed in screenings (screenings weight and DON concentrations) from the initial quantity of DON (precleaned weight and DON concentration), and dividing this by our clean weight (“Expected Clean DON (ppm)” in Table 1). Our results were in the realm of these expectations.
To reduce DON more, we would have to remove screenings with higher DON concentrations, or remove a greater quantity of higher testing material. Perhaps more aggressive cleaning could have further reduced DON in cleaned grain by removing more higher-testing material, but this also would have come at the cost of greater screening losses. Any loss in weight would need to be made up for by improvement in grain value or marketability.
This testing only represents a couple of grain cleaning scenarios, and does not consider the impact of hybrid choice, DON infection levels or different screen sizes or types. It is possible type or severity of infection may impact response to cleaning. If the majority of infection is in fines and cob, or if most infected kernels are very small (ie. ear-tip only infections) perhaps there may be greater responses to cleaning by size.
Acknowledgements
Thanks to the producers and industry personnel who took the time to help us conduct these cleaning trials. Thanks to Grain Farmers of Ontario and SGS Labs for supporting analysis costs.
Source : fieldcropnews