Crop yields
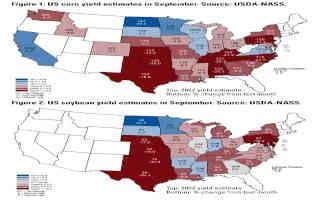
The next piece to the supply puzzle is the yield. The September yield estimates are a combination of the data from USDA’s objective yield survey and the simultaneous farmer yield survey. Figure 1 shows the current corn yield estimates and how they have changed. The national average corn yield estimate fell 2.9 bushels to 172.5 bushels per acre. Iowa’s corn yield estimate was cut by five bushels to 200 bushels per acre. Wisconsin’s corn yield declined by two, but the yield would still a record. Minnesota’s went down by three. North Dakota dropped four bushels and Nebraska decreased by five bushels. The drought and heat stress is definitely showing up across the western Corn Belt. Illinois was one of the few states to see their corn yield estimate rise. Putting together the acreage and yield updates, USDA found evidence to lower the corn production estimate below 14 billion bushels. That is a sizable cut from the 15 billion bushels projected earlier in the year.
But I think the prize for the biggest surprise in the reports goes to the soybean yield adjustment. The national average soybean yield estimate came in at 50.5 bushels per acre, down 1.4 bushels from the August figure. As with corn, most states saw declines. The two areas that were exceptions were the Southeast and Iowa and Wisconsin. Iowa’s soybean yield estimate increased by a bushel to 59 bushels per acre. Wisconsin’s yield also rose one bushel. Tennessee and Georgia each gained two bushels, while the Carolinas each gained one. Kansas and Maryland took the largest cuts, at eight bushels each. Illinois’ yield fell two bushels, along with Missouri, Kentucky, and South Dakota. Overall, national soybean production is projected at 4.378 bushels, which would still be the fourth largest, trailing only the 2017, 2018, and 2021 crops.
Corn usage was also updated, with cuts impacting the major usage categories. The slowdown in ethanol production over the past six weeks translated into a 20 million decline in corn grind out of the 2021 crop. However, corn export sales out of the 2021 crop were increased by 25 million bushels. With the 5 million bushels subtracted from stocks, the 2021-22 corn ending stocks are projected at 1.525 billion bushels. The offsetting changes allowed USDA to maintain its 2021-22 season-average price estimate at $5.95 per bushel. For the new (2022) crop, feed and residual usage and exports were both cut by 100 million bushels and corn usage for ethanol was slashed by 50 million bushels. Overall corn usage is projected to be nearly 600 million bushels lower for the new corn marketing year. 2022-23 ending stocks are now set at 1.219 billion bushels, down 170 million from last month and down 306 million from last year. The 2022-23 season-average price estimate rose 10 cents to $6.75 per bushel.
Soybean usage adjustments reduced domestic and international consumption. For the 2021 crop, exports were lowered by 15 million bushels, reflecting lower sales into China as crushing margins there are poor. That change boosted the 2021-22 ending stocks to 240 million bushels, so stocks rose, but the market remains tight. The 2021-22 season-average price estimate held steady at $13.30 per bushel. For the 2022 crop, the usage reductions spread and grew. Domestic crush dropped by 20 million bushels, so while domestic usage is still expected to grow, that growth was cut in half. The larger reduction hit in exports, with 70 million bushels removed there, based on a combination of greater global supplies and more competition. Despite the losses in usage, 2022-23 ending stocks are projected at 200 million bushels, down 45 million from last month and down 40 million from last year. And the 2022-23 season-average price estimate held at $14.35 per bushel.
With the September reports coming in with smaller crops, thoughts are more production cuts are coming. The market adage goes: big crops get bigger and small crops get smaller. Futures prices for both crops reacted positively to the reports, with soybeans seeing the (much) larger gains. The price moves brought futures prices back roughly in line with USDA projections. But the reports also revealed the concerns about crop demand. All of the major demand sectors were cut within the reports. For the moment, USDA’s adjustments have supplies falling faster than usage, which supports prices. But if those usage declines accelerate, the price support can disappear quickly.
Source : iastate.edu